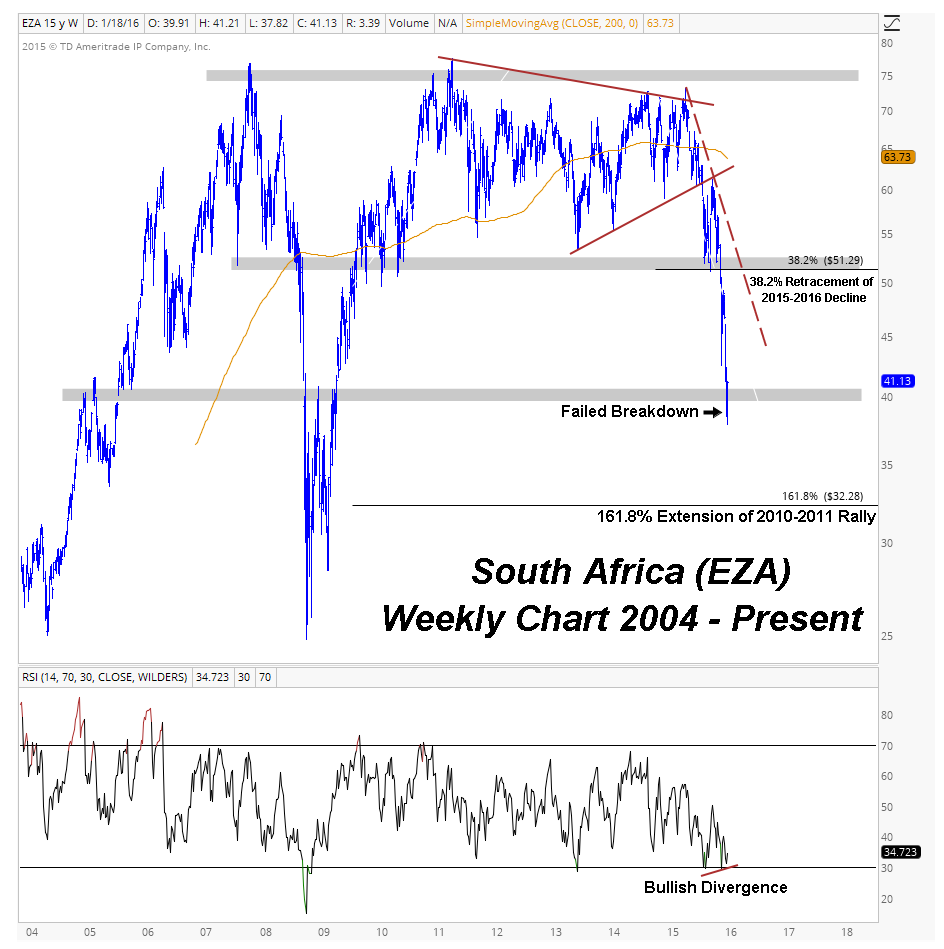
Headline: Unveiling the Secrets: The Ultimate Guide to the Best Trading Charts in South Africa

Image: allstarcharts.com
Introduction:
In the fast-paced, ever-evolving world of finance, savvy investors are constantly seeking an edge that can elevate their trading strategies to new heights. Trading charts serve as indispensable tools in this pursuit, providing investors with crucial insights into market movements and empowering them to make informed decisions. South Africa, with its vibrant and dynamic financial landscape, presents a plethora of trading chart options, each designed to cater to specific trading styles and objectives.
Embark on a comprehensive journey into the realm of trading charts in South Africa. Our comprehensive guide will not only unravel the intricacies of various chart types but also equip you with the knowledge and skills to select the perfect chart for your trading needs. Whether you’re a seasoned trader or a novice just starting out, this guide will elevate your trading game and propel you towards financial success.
Delving into the World of Trading Charts in South Africa:
Trading charts are graphical representations of historical price movements, offering a comprehensive visual aid for traders to analyze market trends and patterns. Various chart types exist, each with distinct characteristics and purposes:
Candlestick Charts: These are among the most popular chart types and are revered by traders for their ability to capture price movements within a specific time frame, including opening, closing, high, and low prices. Candlesticks visually represent these price fluctuations using colored bars, making it easy to identify market trends and potential trading opportunities.
Bar Charts: Bar charts are another prevalent chart type, showcasing opening, closing, high, and low prices. They are more straightforward than candlestick charts, displaying price movements as vertical lines with horizontal lines indicating the opening and closing prices.
Line Charts: Line charts connect closing prices over time, providing a simple and clear view of overall price trends. They are particularly useful for identifying long-term patterns and gauging the general direction of a market.
Point and Figure Charts: Point and figure charts utilize a unique method of representing price movements, focusing solely on price changes without incorporating time considerations. They are often employed to identify potential trading levels and trend reversals.
TradingVolume Charts: Trading volume charts illustrate the volume of trading activity for a given security, providing insight into the intensity of buying and selling pressure. High trading volume can often corroborate market trends and indicate potential breakouts or reversals.
Expert Insights and Actionable Tips:
Navigating the myriad of trading charts available in South Africa can be daunting. To guide you towards the best choices, we sought the counsel of seasoned trading experts:
“Trading charts are the cornerstone of technical analysis,” shared Greg Bell, a renowned trader with over two decades of experience. “Choosing the right chart for your trading style is paramount. For short-term trading, candlestick charts offer a detailed snapshot of price action. For long-term investors, line charts provide a broader perspective of market trends.”
Echoing this sentiment, Sarah Khan, a financial analyst, emphasized: “Trading volume charts are often overlooked but can be invaluable for gauging market sentiment. High trading volume can confirm trends, while low volume can indicate a lack of conviction in a move.”
Conclusion:
Trading charts are indispensable tools for investors in South Africa, providing a roadmap to navigate the intricacies of financial markets. By understanding the different chart types and their strengths and limitations, you can select the best chart to align with your trading strategy. Remember, the journey to successful trading is an ongoing process of learning, adapting, and refining your approach. Embrace the wisdom of experts, experiment with various charts, and develop a deep understanding of market patterns. Remember, the best trading chart for you is the one that empowers you to make informed decisions and achieve your financial aspirations. May this guide serve as a beacon of knowledge, guiding you towards trading success in the dynamic and ever-evolving financial landscape of South Africa.

Image: theforexgeek.com
Best Trading Chart South Africa


