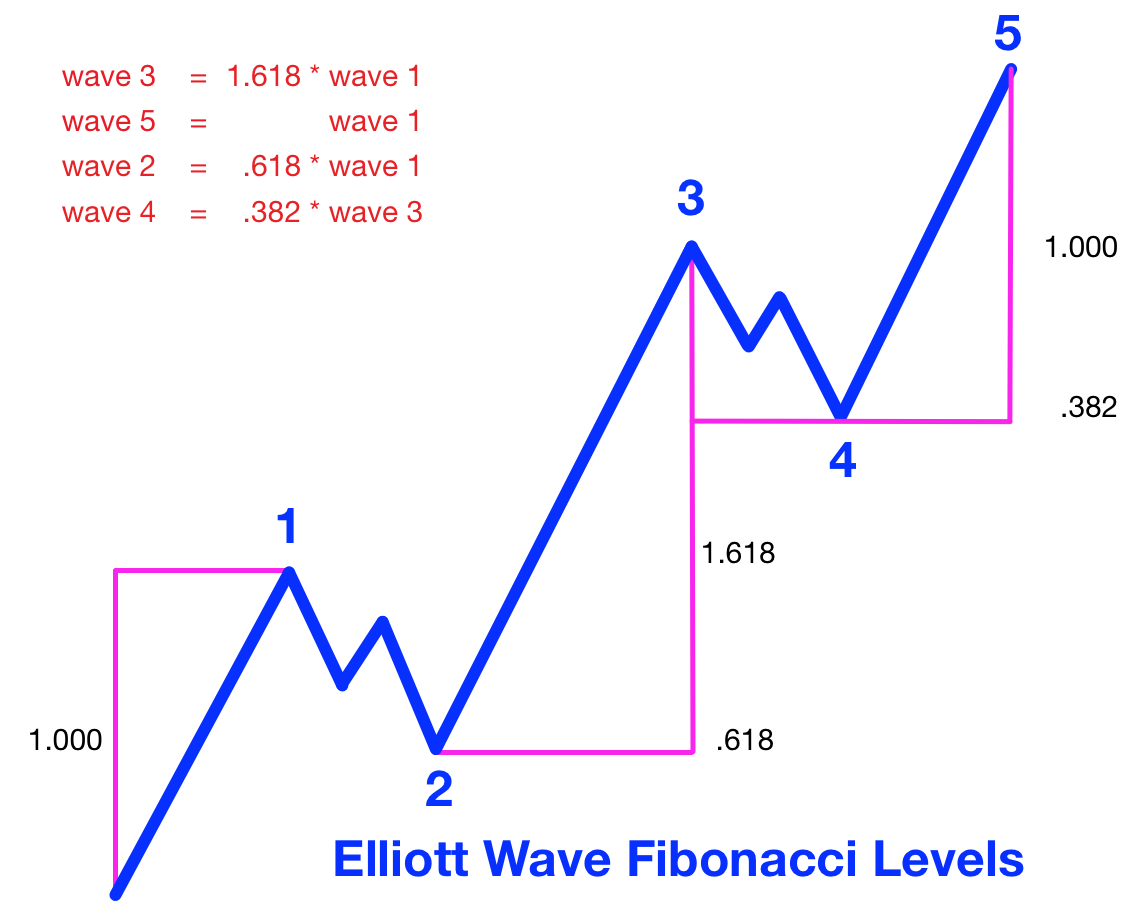
Title: Unlock the Secrets of Fibonacci Levels: A Guide to Reading the Market Like a Pro

Image: timepriceanalysis.com
Engaging Introduction:
In the ever-changing landscape of financial markets, traders and investors seek an edge, a way to understand the hidden patterns that drive price movements. Enter the Fibonacci levels, a powerful tool that can provide invaluable insights into market behavior. This comprehensive guide will equip you with the knowledge and skills needed to read and interpret Fibonacci levels, empowering you to make informed trading decisions.
Fibonacci levels are derived from the mathematical Fibonacci sequence, where each number is the sum of the two preceding ones. This sequence holds a remarkable property: the ratio between successive Fibonacci numbers approaches 1.618, known as the Golden Ratio. In financial markets, the Golden Ratio and other key Fibonacci ratios are believed to manifest as support and resistance levels where prices tend to bounce off or reverse direction.
Deep Dive into Reading Fibonacci Levels:
Foundation:
The Fibonacci sequence is 0, 1, 1, 2, 3, 5, 8, 13, 21, 34, 55, 89, 144, and so on. The important Fibonacci ratios for trading are:
- 0%: Starting point of the trend
- 23.6%: Initial support or resistance level
- 38.2%: Significant support or resistance level
- 50%: Midpoint of the trend
- 61.8%: Strong support or resistance level
- 78.6%: Potential reversal zone
- 100%: End of the trend
Price Projections and Retracements:
Fibonacci levels not only identify support and resistance but also help project price targets and potential retracements. By measuring the distance between two significant price points, traders can determine potential levels where prices might encounter resistance or retracement.
Drawing Fibonacci Levels:
Retracement Levels:
- Identify two significant price points: a high and a low.
- Using a technical analysis platform, draw a Fibonacci retracement tool from the high to the low.
- The tool will automatically display the key Fibonacci levels (23.6%, 38.2%, 50%, etc.)
Projection Levels:
- Draw a trendline connecting two consecutive higher highs or lower lows.
- Extend the trendline using the Fibonacci projection tool.
- The tool will project potential price targets based on Fibonacci ratios (61.8%, 78.6%, 100%, etc.)
Interpretation:
Fibonacci levels are not rigid lines; they represent areas of support and resistance. Prices may not touch these levels precisely but may bounce off or reverse direction around them. However, as more Fibonacci levels are tested, their significance increases.
Expert Insights and Actionable Tips:
“Fibonacci levels are one of the most valuable tools in my trading arsenal,” says renowned trader Mark Douglas. “They provide a framework for understanding market dynamics and identifying potential trading opportunities.”
Tips for Effective Fibonacci Trading:
- Combine Fibonacci levels with other technical indicators for confirmation.
- Use daily, weekly, or monthly charts for longer-term analysis.
- Exercise patience and wait for multiple Fibonacci levels to be tested.
- Avoid using Fibonacci levels on high-volatile or range-bound markets.
Compelling Conclusion:
Mastering how to read Fibonacci levels is a transformative skill that can elevate your trading prowess. By understanding the Fibonacci sequence and its implications for market behavior, you can decipher the language of price movements, anticipate potential reversals, and make more informed trading decisions. Embrace these golden ratios and unlock the power of Fibonacci trading.

Image: www.youtube.com
How To Read Fibonacci Levels


