

In the realm of financial markets, where patterns and trends often hold the key to success, the Fibonacci series emerges as a powerful tool, providing traders with valuable insights into market movements and potential trading opportunities. This ancient sequence of numbers, discovered by the Italian mathematician Leonardo Fibonacci over a millennium ago, has fascinated scholars and practitioners alike, revealing intricate relationships in nature, art, and, remarkably, the financial world.

Image: www.brokerxplorer.com
At its core, the Fibonacci series is a simple sequence where each number is the sum of the two preceding ones. Starting with 0 and 1, the sequence continues as 1, 2, 3, 5, 8, 13, and so on. What makes this series extraordinary is the presence of the Golden Ratio, approximately 1.618, which arises when successive Fibonacci numbers are divided. This ratio has been observed in countless natural phenomena, from the spirals of seashells to the branching patterns of trees, and is widely considered aesthetically pleasing.
Harnessing the Fibonacci Series in Trading
Traders have ingeniously applied the Fibonacci series to the analysis of price charts, seeking to identify potential support and resistance levels, retracement zones, and potential reversal points. By overlaying the Fibonacci ratios on a chart, traders can uncover potential areas where the price may pause, reverse, or continue its trend.
Some of the most commonly used Fibonacci ratios in trading include:
- 23.6% retracement: Indicates a potential area where the price may pull back by 23.6% of its previous move.
- 38.2% retracement: A deeper retracement level that suggests the price may pull back by 38.2%.
- 50% retracement: Represents the midpoint of a previous move, indicating a potential area for a pause or reversal.
- 61.8% retracement: A significant retracement level that implies the price may retrace by 61.8% before continuing its trend.
Fibonacci Extension Levels
In addition to retracement levels, traders also use Fibonacci extension levels to identify potential targets for price movements. These levels are calculated by extending the Fibonacci ratios beyond the previous swing high or low.
Some of the common extension levels include:
- 100% extension: Represents the original distance of the previous move.
- 161.8% extension: A potential target for a strong trend, indicating the price may extend by 161.8% of its previous move.
- 261.8% extension: A rarer but highly significant target, suggesting a potential move of 261.8%.
Practical Applications of the Fibonacci Series
To illustrate the practical application of the Fibonacci series in trading, consider the following example:
Suppose a stock experiences a surge in price, moving from $100 to $120. Using Fibonacci retracement levels, we can identify potential areas where the price may retrace before resuming its upward trend. The 38.2% retracement level would be located at $115.20 ($120 – ($120 – $100) x 0.382), indicating a potential area for a price dip.
If the stock continues to decline and breaks below the 38.2% retracement level, the next Fibonacci level to watch would be the 50% level at $110. This level represents a critical support area, indicating a potential point of reversal where buyers may step in.
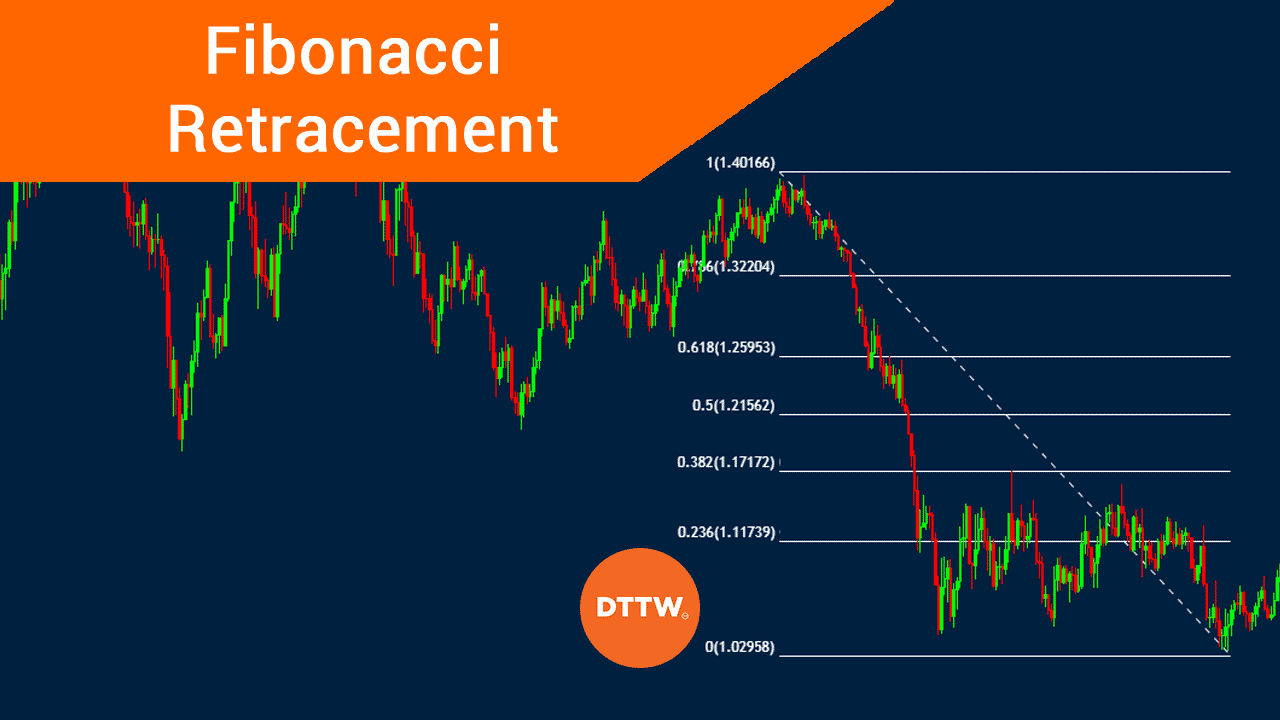
Image: www.daytradetheworld.com
Fibonacci Trading Strategies
While the Fibonacci series provides valuable insights, it’s important to note that it’s not a perfect predictor of market behavior. Traders should integrate it with other technical analysis tools and consider it as part of a comprehensive trading strategy.
Some of the trading strategies that incorporate Fibonacci levels include:
- Retracement trading: Trailing stops can be placed at Fibonacci retracement levels to protect profits or enter positions at support levels during pullbacks.
- Trend continuation: Fibonacci extension levels can identify targets for profitable trades by extending the trend in the direction of the prevailing trend.
- Candlestick analysis: Combining Fibonacci levels with candlestick patterns can enhance the accuracy of trade setups.
Fibonacci Series In Trading
Conclusion
The Fibonacci series offers a powerful tool for traders seeking to uncover potential turning points, retracement zones, and targets in the financial markets. By overlaying Fibonacci ratios and extension levels on price charts, traders can gain valuable insights into market movements and make more informed trading decisions.
Remember to approach Fibonacci analysis with a sense of caution, combining it with other technical analysis tools and sound risk management practices. Embracing the Fibonacci series as part of your trading arsenal can elevate your trading outcomes and navigate the ever-changing market landscape with greater confidence.


