

When faced with the fluctuating tides of the financial markets, traders seek every advantage to navigate its complexities. The Fibonacci retracement tool stands out as a reliable beacon, guiding traders in identifying potential reversals and price movements. Embark on this comprehensive exploration as we delve into the intricacies of this indispensable tool, empowering you with the knowledge to make informed trading decisions.

Image: mungfali.com
Unveiling the Fibonacci Retracement Tool: A Guiding Light in Market Analysis
The Fibonacci retracement tool is a fundamental technical analysis technique founded upon the mathematical principles of the Fibonacci sequence. This ubiquitous sequence, often found in nature and art, unfolds a harmonious progression in which each number equals the sum of the two preceding ones.
In the financial realm, Fibonacci retracement levels are derived from the Fibonacci sequence and applied to price charts to pinpoint potential areas of support and resistance. These levels, denoted by horizontal lines, serve as potential targets for price pullbacks, reversals, or continuations.
Leveraging Fibonacci Levels for Strategic Trading
Fibonnaci retracement levels are typically drawn at 23.6%, 38.2%, 50%, 61.8%, and 78.6%, representing pivotal psychological levels where market participants may react to price movements. These levels serve as a roadmap for traders, allowing them to anticipate price reactions and adjust their trading strategies accordingly.
When the market reverses after an uptrend, the Fibonacci retracement tool can identify potential support levels at which buyers may step in, indicating a possible reversal or a bounce in the price. Conversely, in a downtrend, Fibonacci resistance levels can indicate areas where sellers may become active, leading to a potential reversal or a continuation of the decline.
Mastering Fibonacci Retracements: A Practical Guide
Navigating the complexities of the Fibonacci retracement tool may seem daunting at first, but understanding its application is paramount for effective trading. Here’s a step-by-step breakdown:
-
Identify a Trend in Price Action: The Fibonacci retracement tool is most effective when applied to trending markets. Analyze price action to determine the direction of the prevailing trend, be it up or down.
-
Determine the High and Low Points: Identify the extreme highs and lows within the trend you have identified. These points will serve as the endpoints for drawing the Fibonacci retracement levels.
-
Construct the Retracement Levels: Using a Fibonacci calculator or trading platform tool, draw horizontal lines at the Fibonacci retracement levels (23.6%, 38.2%, 50%, 61.8%, and 78.6%) between the high and low points you established.
-
Interpret the Levels: Monitor price action in relation to the Fibonacci retracement levels. If the price approaches a retracement level and pauses or reverses, it may indicate a potential support or resistance area.
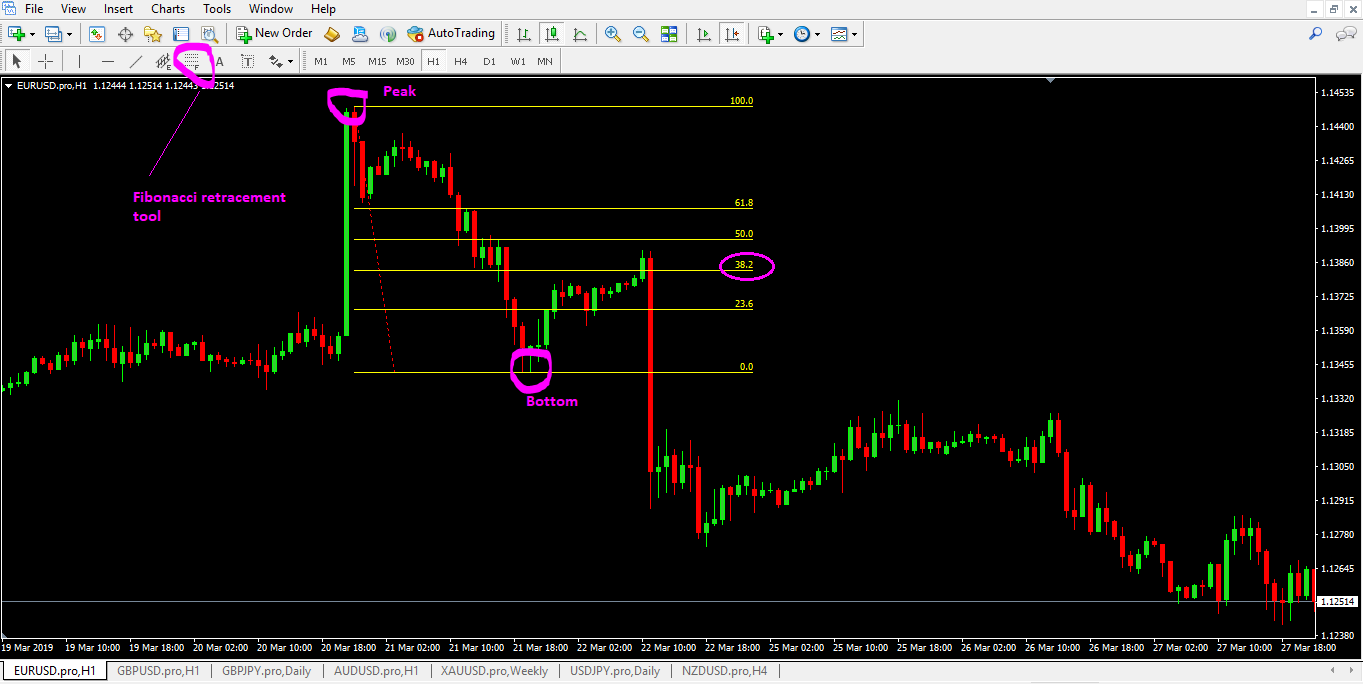
Image: www.forextrading200.com
Expert Insight: Unlocking the Power of Fibonacci
“The Fibonacci retracement tool is a powerful tool for identifying potential turning points in the market,” says renowned trader Andrew Cardwell. “Its ability to forecast price targets and provide insights into market sentiment makes it an invaluable asset for informed trading decisions.”
Practical Applications: Harnessing Fibonacci Retracements in Real-World Trading
To illustrate the practical applications of Fibonacci retracement, consider this example:
EUR/USD is in a downtrend, with a high of 1.1500 and a low of 1.1300. Based on these price points, the Fibonacci retracement levels are:
- 23.6%: 1.1416
- 38.2%: 1.1452
- 50%: 1.1486
- 61.8%: 1.1518
- 78.6%: 1.1544
If EUR/USD falls and approaches the 38.2% Fibonacci retracement level (1.1452), this level may act as a potential support zone, where buyers could step in to push the price higher. Conversely, if the price continues to fall and breaches the 61.8% Fibonacci retracement level (1.1518), it could indicate a continuation of the downtrend.
How To Use The Fibonacci Retracement Tool
Conclusion: Empowering Traders with Fibonacci Wisdom
The Fibonacci retracement tool is a crucial asset in the arsenal of informed traders, offering valuable insights into price retracements and potential trading opportunities. By skillfully applying the Fibonacci retracement technique, alongside other technical analysis tools, traders can confidently navigate the financial markets, uncover profitable trading setups, and confidently capitalize on market movements. Embrace the Fibonacci sequence’s guiding principles and unlock the key to enhanced trading success.


