Introduction:
In the dynamic world of Forex trading, understanding the trend is paramount to making informed and profitable decisions. Trendlines are an essential technical analysis tool that allows traders to identify and forecast price movements. Among the many types of trendlines used in Forex trading, support and resistance trendlines hold a prominent position. This article delves into the intricacies of support and resistance trendlines, unraveling their significance and providing practical tips on how to effectively use them in your trading strategy.

Image: forextraininggroup.com
Defining Support and Resistance Trendlines:
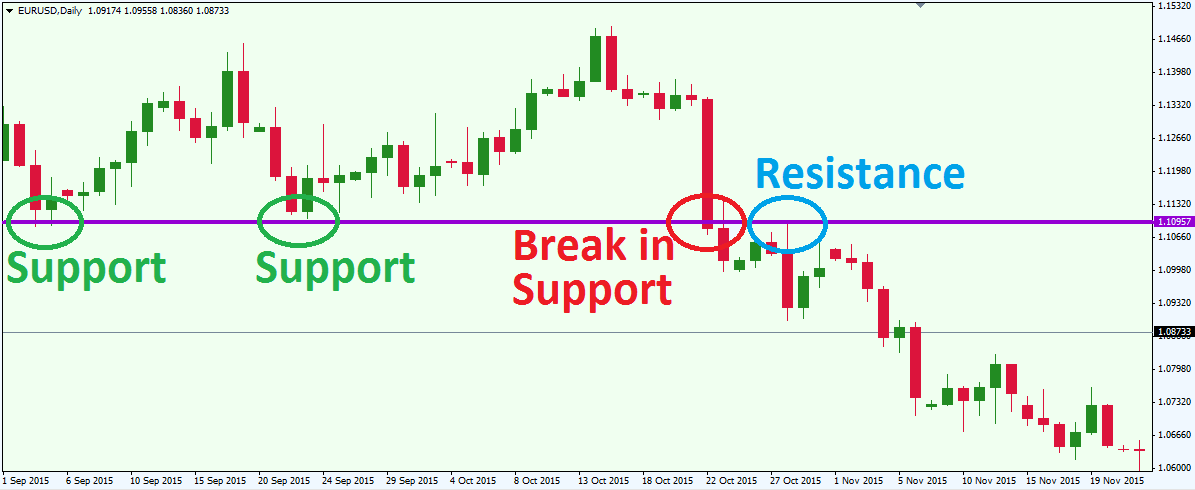
Support and resistance trendlines are diagonal lines drawn across a price chart that connect a series of consecutive lows (support) or highs (resistance). Support lines represent price levels where the downtrend has stalled, offering temporary support to the price. Conversely, resistance lines represent price levels where the uptrend has encountered resistance, leading to a pause or reversal in the price movement. Identifying these trendlines enables traders to understand the overall direction of the trend and potential price reversals.
Importance of Support and Resistance Trendlines:
Support and resistance trendlines serve as pivotal indicators in Forex trading, providing valuable insights for traders:
-
Trend Identification: Trendlines help traders identify the prevailing trend, whether bullish or bearish. By connecting consecutive lows or highs, traders can visually observe the direction of price movement.
-
Trend Continuation: Trendlines act as dynamic levels that guide price action. If the price consistently bounces off a support or resistance line, it indicates that the trend is likely to continue in the same direction.
-
Potential Reversals: When the price breaks through a support or resistance line, it signals a potential trend reversal. A break above resistance indicates a bullish breakout, while a break below support suggests a bearish reversal.
-
Trading Strategy Development: Support and resistance trendlines serve as crucial parameters for stop-loss and take-profit levels. Traders can place stop-loss orders below support lines or above resistance lines to minimize losses. Conversely, take-profit orders can be placed above support lines or below resistance lines to capture potential profits.
Drawing Support and Resistance Trendlines:
Drawing accurate support and resistance trendlines requires practice and attention to detail. Here’s a step-by-step guide:
-
Identify consecutive lows or highs: First, scan the price chart for a series of lower lows or higher highs that occur consecutively.
-
Connect the points: Draw a diagonal line connecting the first and third low or high in the sequence. This line serves as the initial trendline.
-
Adjust the line: As the market action progresses, adjust the trendline to include new consecutive lows or highs, ensuring that it remains parallel to the previous trend.

Image: www.tradingview.com
Trading with Support and Resistance Trendlines:
Traders can leverage support and resistance trendlines to craft effective trading strategies:
-
Trend Continuation: Monitor the price action around support or resistance lines. If the price bounces off the trendline, consider entering a trade in the direction of the trend.
-
Trading Breakouts: When the price breaks through a trendline, wait for the market to stabilize and enter a trade in the direction of the breakout. However, ensure that the breakout is supported by other technical analysis tools or indicators.
-
Managing Risk: Place stop-loss orders below support lines or above resistance lines to limit potential losses. Adjust the stop-loss level as the market evolves.
-
Profit Targets: Set take-profit orders above support lines or below resistance lines to capitalize on price movements. Adjust the take-profit level according to risk tolerance and trading objectives.
Support And Resistence Trendline Forex Indicator
Conclusion:
Support and resistance trendlines are powerful tools that empower Forex traders to make informed decisions about market trends and price movements. By understanding the principles of support and resistance and applying them effectively, traders can enhance their trading strategies, minimize risks, and maximize profit potential. Remember, practice and experience are crucial in mastering the art of trading with support and resistance trendlines.


