

Unlock Market Insights and Empower Your Trading Decisions
Do you find yourself perplexed by the intricate tapestry of forex charts? Do you yearn to decipher the secrets they hold and gain an edge in the dynamic forex market? If so, you have arrived at the perfect destination. In this comprehensive guide, we will embark on a journey through the world of forex charts, unlocking their valuable insights and empowering you to make informed trading decisions.

Image: www.talk-business.co.uk
By delving into the anatomy of forex charts, we will unravel the significance of candlestick patterns, price action, moving averages, and support and resistance levels. We will explore the subtle nuances that differentiate bullish and bearish trends, providing you with the knowledge to predict market movements with greater accuracy.
The Intricacies of Candlestick Patterns
Candlestick patterns serve as visual representations of price movements over specific periods. Each candlestick consists of a body and two wicks, capturing the opening, closing, highest, and lowest prices within that interval. By studying candlestick formations, traders can glean valuable insights into market sentiment and momentum.
For instance, a long green candle signifies a bullish period, indicating that the closing price is significantly higher than the opening price. Conversely, a long red candle denotes a bearish period, suggesting a substantial decline in price. Mastering the interpretation of candlestick patterns is crucial for identifying trend reversals and potential trading opportunities.
Navigating Price Action: Momentum and Volatility
Price action analysis involves studying the dynamics of price movements in real-time. It provides insights into market sentiment, volatility, and support and resistance levels. By observing how price fluctuates around these levels, traders can gauge the potential direction of future price movements.
Analyzing price action aids in identifying potential trading setups, such as breakouts, pullbacks, and consolidations. It also helps traders adapt to changing market conditions and adjust their positions accordingly, enhancing their responsiveness to market volatility.
Unveiling Moving Averages: Smoothing Out Market Noise
Moving averages (MAs) are technical indicators that smooth out price fluctuations, revealing underlying trends and market bias. They represent the average price over a specified period, often calculated using closing prices. Popular MAs include simple moving averages (SMAs), exponential moving averages (EMAs), and weighted moving averages (WMAs).
Moving averages provide visual cues for trend identification, support and resistance levels, and potential trade entries and exits. By analyzing the relationship between price and MAs, traders can determine whether a trend is strengthening or weakening, and make informed decisions based on market conditions.
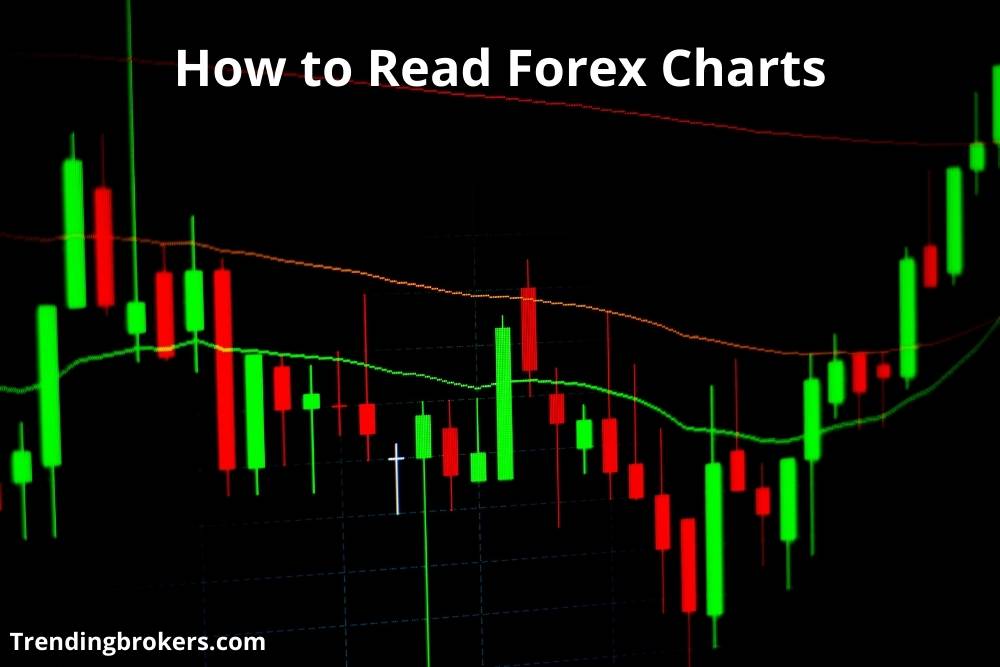
Image: trendingbrokers.com
Identifying Support and Resistance: Defining Market Boundaries
Support and resistance levels are crucial price points that act as temporary barriers for price movements. Support levels represent price floors where buying pressure pushes prices back up, while resistance levels mark price ceilings where selling pressure halts further price appreciation.
Recognizing support and resistance levels empowers traders to identify potential trading opportunities at key inflection points. Breakout strategies involve trading in line with the direction of a breakout from these levels, while retracement strategies focus on capitalizing on price pullbacks to support or resistance before resuming the prevailing trend.
Empowering Traders with Expert Tips and Advice
To enhance your forex chart reading skills, consider these invaluable tips from seasoned traders:
- Practice consistently: The key to mastering chart reading is consistent practice. Dedicate time to studying historical charts and applying your knowledge in real-time.
- Combine technical indicators: While technical indicators provide valuable insights, they should not be used in isolation. Combine multiple indicators to validate signals and enhance confidence in your trading decisions.
- Manage risk: Always prioritize risk management. Understand your risk tolerance and implement appropriate risk management strategies to safeguard your capital.
Frequently Asked Questions
- Q: What is the most important aspect of chart reading?A: The ability to identify price patterns, trends, and support and resistance levels.
- Q: Is chart reading sufficient for profitable trading?
How To Read Forex Charts
Conclusion
Mastering the art of forex chart reading unlocks a world of trading possibilities. By delving into the intricacies of candlestick patterns, price action, moving averages, and support and resistance levels, you empower yourself with the knowledge to decipher market sentiment, identify trends, and time your trades precisely. Remember, practice and patience are key to honing your skills and consistently profiting in the dynamic forex market.
Are you ready to unlock your potential as a successful forex trader? Embark on this journey of chart reading mastery today and empower your trading decisions.


