

In the realm of financial trading, candlesticks have emerged as a powerful tool for charting price movements and identifying potential trading opportunities. These stylized representations of price data offer a wealth of information that can be deciphered to gain valuable insights into market behavior and make informed trading decisions. This article aims to delve into the world of candlestick patterns, equipping readers with a comprehensive understanding of their formation, interpretation, and application in real-world trading scenarios.

Image: fxtradinger.com
Candlestick Patterns: A Foundation of Technical Analysis
Candlesticks find their origins in the ancient Japanese rice markets, where traders sought to predict price movements by observing the relationship between open, high, low, and close prices over a defined time frame. Each candlestick represents a single trading period, which can range from minutes to days or even months. The shape and composition of a candlestick convey crucial information about market sentiment and the dynamics between buyers and sellers.
The body of the candlestick, represented by a rectangular block, illustrates the difference between the asset’s opening and closing prices. A filled or solid body indicates a decline in price (bearish), while an empty or unfilled body signifies a price increase (bullish). The wicks, extending from the top and bottom of the body, represent the highest and lowest prices reached during the trading period.
Interpreting Candlestick Patterns
The interpretation of candlestick patterns involves recognizing specific shapes and formations that occur on price charts. These patterns, formed by the interaction of multiple candlesticks, provide insights into market trends and reversals. Some of the most common and reliable candlestick patterns include:
-
Bullish Patterns:
- Hammer: A small body with a long lower wick, indicating a reversal from a downtrend to an uptrend.
- Bullish Engulfing Pattern: A large green candlestick that completely engulfs the previous bearish candlestick, representing buyers regaining control.
-
Bearish Patterns:
- Hanging Man: A small body with a long upper wick, suggesting a potential reversal from an uptrend to a downtrend.
- Bearish Engulfing Pattern: A large red candlestick that fully encloses the previous bullish candle, indicating sellers overpowering buyers.
-
Neutral Patterns:
- Doji: A cross-shaped candle with a small body and almost equal wicks, suggesting indecision and a potential change in market direction.
- Spinning Top: A candlestick with a small body and long wicks, resembling a spinning top, indicating market uncertainty.
Applications of Candlestick Patterns in Trading
Candlestick patterns play a significant role in technical analysis and are widely used by traders to make informed trading decisions. When combined with other technical indicators and chart patterns, candlestick patterns can provide valuable insights into:
- Identifying potential trading opportunities: Reversal patterns signal potential changes in market direction, allowing traders to enter or exit trades with greater confidence.
- Confirming trends: Trend continuation patterns reinforce existing market trends, providing confirmation for traders to remain in the current position.
- Assessing market sentiment: Candlestick patterns can gauge the dominant sentiment in the market, whether bullish or bearish, influencing traders’ trading strategies.
- Timing market entries and exits: Identifying candlestick patterns at support or resistance levels can help traders determine optimal entry and exit points, maximizing their chances of successful trades.
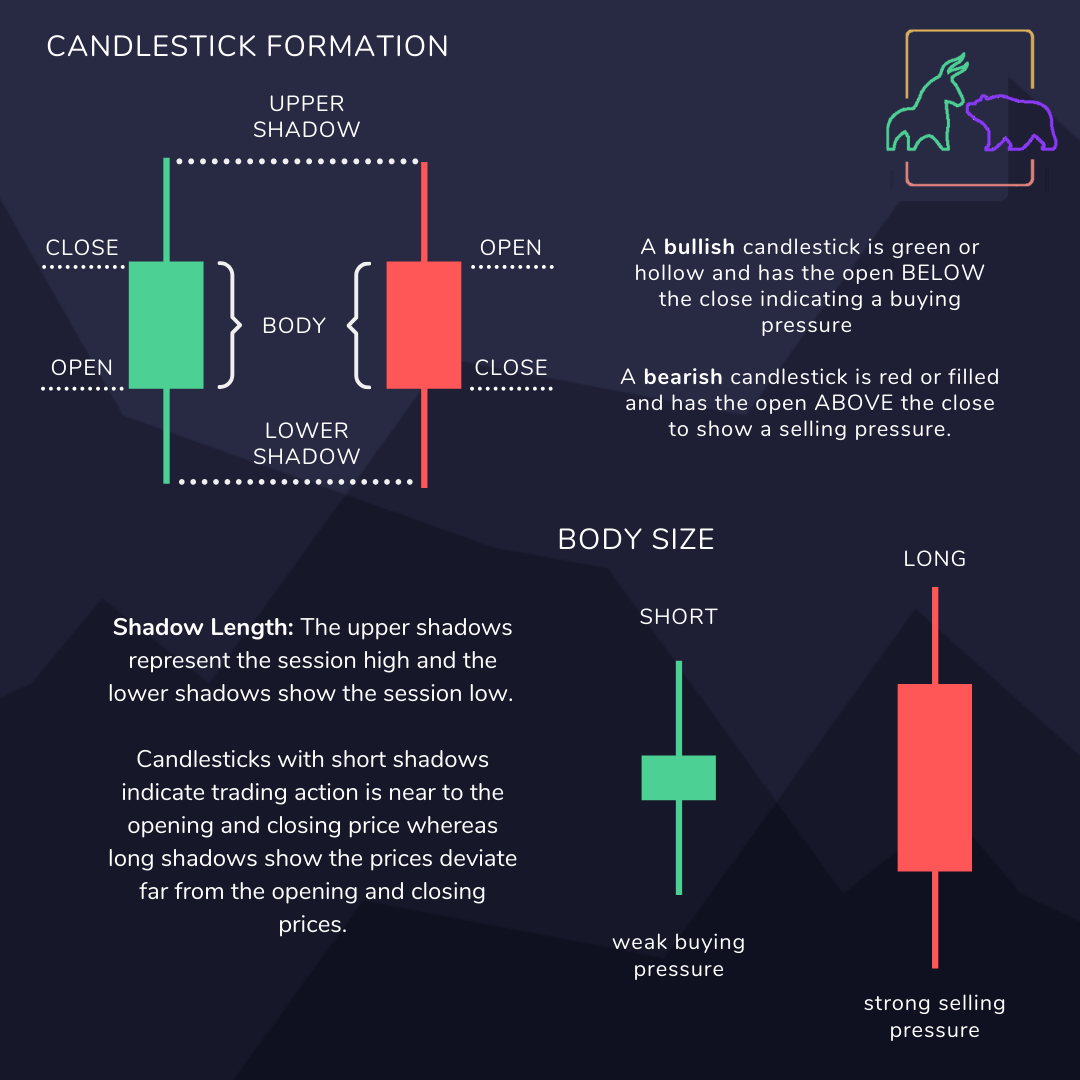
Image: blog.bullbear.io
Beyond Basic Candlestick Patterns
While understanding the fundamentals of candlestick patterns is crucial, traders should also be aware of more advanced patterns, such as:
- Harami Patterns: Nested candle formations that signal a shift in momentum and a potential reversal.
- Inside Bars: Candlesticks that form entirely within the range of the previous candlestick, indicating consolidation and potential breakout opportunities.
- Three Line Strike Patterns: Consecutive candlesticks that test a specific price level three times, indicating strong resistance or support.
Mastering Candlestick Patterns: Practice and Refinement
Proficiency in reading candlestick patterns requires practice and refinement. Backtesting, which involves analyzing historical charts and applying technical indicators, is a valuable technique for traders to improve their pattern recognition skills. Additionally, studying real-time price charts and following market news can enhance a trader’s understanding of candlestick patterns’ behavior in varying market conditions.
How To Read Candlestick Patterns
Conclusion: Unveiling the Secrets of Candlestick Patterns
Candlestick patterns offer a concise and visual representation of price action, providing valuable insights into market trends, reversals, and sentiment. Mastering the interpretation and application of candlestick patterns empowers traders to make informed trading decisions, identify potential opportunities, and improve their trading performance. Whether a seasoned trader or a newcomer to technical analysis, understanding candlestick patterns is a fundamental skill that can unlock the secrets of the financial markets.


