

Dive into the Labyrinth of Currency Movements
Immerse yourself in the intricate world of forex graphs, the enigmatic language through which the ebbs and flows of global currency markets unfold. In this comprehensive guide, we unravel the secrets hidden within these charts, empowering you to decipher their enigmatic symbols and unlock the insights they hold. Join us as we embark on a journey through forex graphs, revealing their profound significance in navigating the dynamic and ever-changing financial landscape.

Image: www.talk-business.co.uk
Dissecting the Anatomy of a Forex Graph
A forex graph is a visual representation of the fluctuations in the exchange rate between two currencies over time. Along the vertical axis, you’ll find the value of the base currency (the currency being traded) quoted in units of the counter currency. The horizontal axis represents the time frame, ranging from minutes to months, allowing you to analyze currency movements at various granularities. The graph itself is composed of a series of connected lines or candlesticks, each depicting the opening, closing, high, and low prices for a given time period.
Decoding the Language of Forex Graphs
Forex graphs are a rich source of information, but they can appear overwhelming to the uninitiated. Understanding the key elements of a forex graph is essential for deciphering their meaning. Candlesticks, one of the most common chart types, convey a wealth of information in a single visual representation. The body of the candlestick represents the range between the opening and closing prices, while the wicks (or shadows) extending above and below the body indicate the highest and lowest prices reached during the time period. Green or white candlesticks symbolize price increases, while red or black candlesticks indicate price decreases.
Moving Averages: A Smoother Course
Moving averages are another essential tool for analyzing forex graphs. They smooth out price fluctuations by calculating the average price over a specified number of periods. This technique helps identify trends and support and resistance levels more effectively. Common moving averages include the 50-period moving average, the 100-period moving average, and the 200-period moving average, each providing a different perspective on market trends.
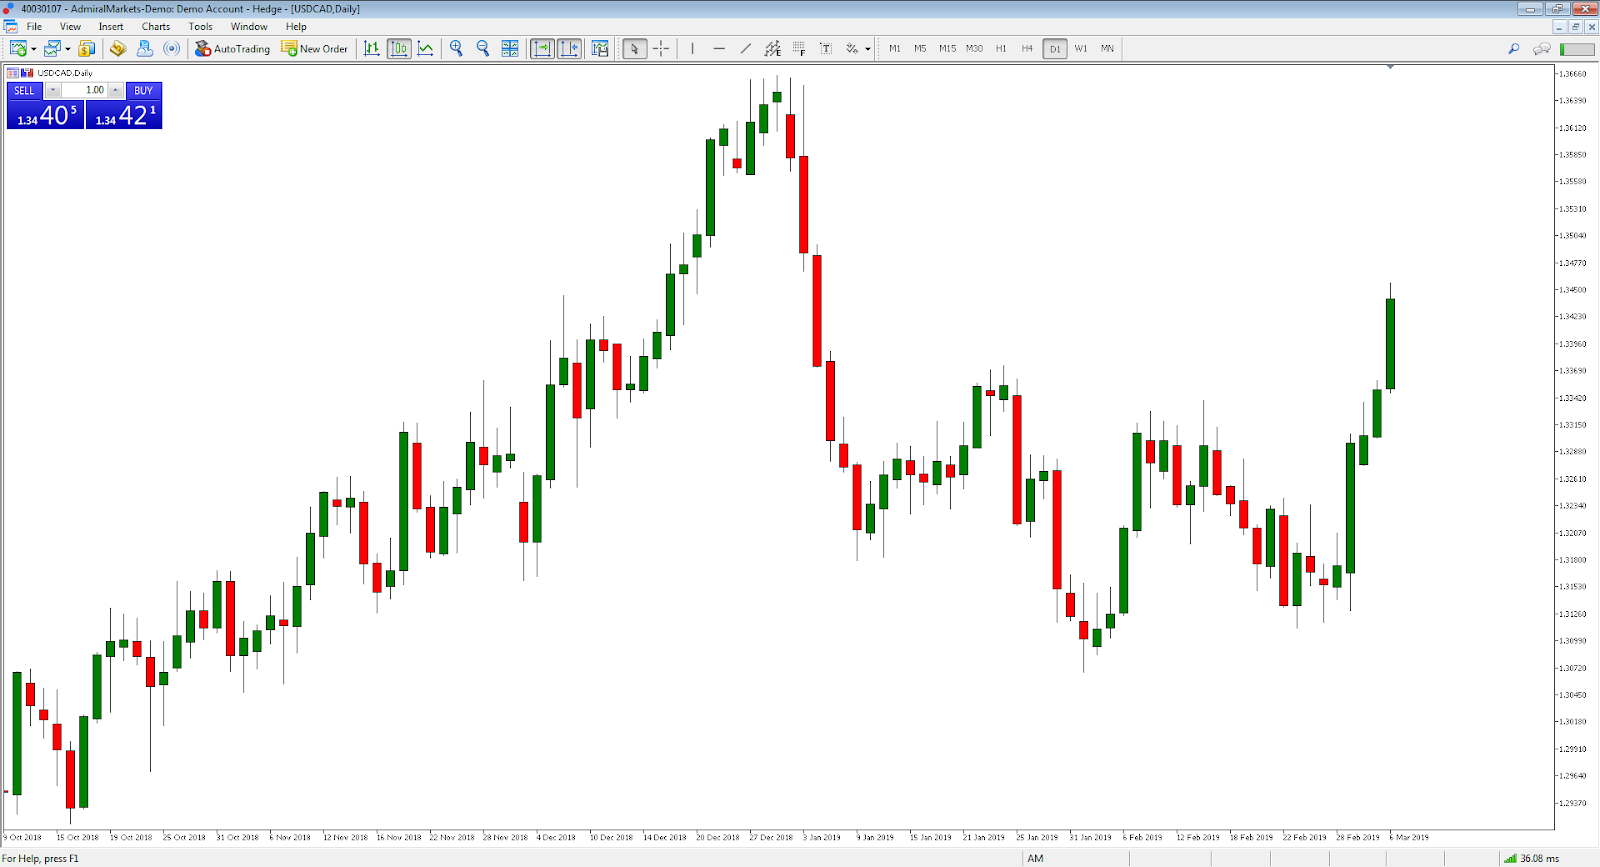
Image: admiralmarkets.com
Trend Lines: Charting the Future
Trend lines are straight lines drawn on a forex graph to connect points of similar price action. They indicate the overall direction of price movements and can be used to identify support and resistance levels, which are crucial for making informed trading decisions. Support lines are drawn below the price action, indicating areas where buyers may step in to prevent further declines, while resistance lines are drawn above the price action, indicating areas where sellers may emerge to halt upward momentum.
Expert Insights: Navigating the Forex Labyrinth
Seasoned forex traders rely on a range of technical indicators to complement their analysis of forex graphs. These indicators provide additional insights into market momentum, volatility, and potential trading opportunities. Some of the most popular technical indicators include Bollinger Bands, the Relative Strength Index (RSI), and Moving Average Convergence Divergence (MACD). By combining these indicators with an understanding of forex graph patterns, traders can enhance their decision-making capabilities and increase their chances of success.
Tips for Forex Graph Mastery
Harnessing the power of forex graphs requires a combination of knowledge, experience, and a keen eye for detail. Here are some invaluable tips to elevate your forex graph interpretation skills:
- Practice relentlessly: Familiarity breeds comprehension. The more you study forex graphs, the more comfortable you will become with their intricacies.
- Understand price scale: Meticulously examine the price scale to ensure you grasp the magnitude of price movements and avoid misinterpretations.
- Look for patterns: Persistent price action patterns often indicate potential trading opportunities. Mastering pattern recognition can significantly enhance your decision-making process.
FAQ
Q: What is a pip in forex?
A: A pip (point in percentage) represents the smallest increment of change in an exchange rate. It typically refers to the fourth decimal place in currency pairs.
Q: How do I calculate pip values?
A: Pip values vary depending on the currency pair being traded and the lot size. The formula for pip value is: Pip Value = (1 / Conversion Rate) * Contract Size.
Q: What is the difference between spot and forward rates?
A: Spot rates represent the current exchange rate for immediate delivery of a currency, while forward rates indicate the agreed-upon exchange rate for future delivery of a currency.
How To Read Forex Graph
Conclusion: Unlocking Forex Graph Secrets
Forex graphs are the gateways to unraveling the complexities of currency markets. By deciphering their multifaceted elements, traders gain the power to identify trends, anticipate price movements, and execute informed trading decisions. Whether you are a seasoned trader or embarking on your forex journey, mastering the art of forex graph interpretation is a journey of continuous learning and reward. Embrace the challenge, hone your skills, and unleash the transformative potential of forex graphs. Are you ready to dive deeper into the world of forex graphs?


