
In the pulsating heart of financial markets, where fortunes are won and lost, lies an invaluable tool: technical analysis. Amidst the fluctuating charts and tangled lines, graph patterns emerge as celestial guides, whispering secrets of market behavior and paving the path towards informed trading decisions.
Image: masterthemarket.teachable.com
Technical analysis graph patterns are enigmatic formations that materialize on price charts, offering ardent investors a glimpse into the future trajectory of security prices. These patterns, forged from historical data and collective market psychology, serve as a Rosetta stone, deciphering the cryptic language of the financial realm.
Types of Graph Patterns
The realm of technical analysis graph patterns is vast and multifaceted, with each formation carrying its own unique tale to tell. Some of the most prevalent patterns include:
-
Head and Shoulders: This classic pattern signals a potential reversal in the market’s prevailing trend. It features a central peak flanked by two smaller peaks, resembling the silhouette of a human skull.
-
Double Top and Double Bottom: These patterns indicate indecision and potential trend reversals. A double top forms when a security reaches the same price peak twice, while a double bottom forms when it touches the same price trough twice.
-
Triple Top and Triple Bottom: A more significant variation of the double top and double bottom patterns, they indicate stronger trend reversals and potential breakout opportunities.
-
Triangles: These patterns are formed by converging trendlines and can signal either a continuation or reversal trend. Ascending triangles suggest an upward breakout, while descending triangles imply a downward breakout.
-
Flags and Pennants: These patterns are characterized by a consolidation period represented by a channel or wedge. A breakout from these patterns can signify a continuation in the previous trend.
-
Gartley Pattern: This complex pattern is based on Fibonacci ratios and involves four distinct price swings that follow a specific mathematical relationship. It can indicate potential reversal points.
Harnessing the Power of Graph Patterns
To effectively harness the power of technical analysis graph patterns, traders must possess a discerning eye and a deep understanding of their significance. Patterns should be interpreted within the context of the broader market environment, considering price trends, support and resistance levels, and other technical indicators.
Expert traders often employ multiple patterns and indicators in conjunction to enhance the reliability of their analysis. By studying historical data, they gain insights into the typical behavior of each pattern and its potential outcomes.
Actionable Insights
Technical analysis graph patterns provide invaluable guidance for informed trading decisions:
-
Identify Trends: Patterns can help identify potential trend reversals or continuations, providing a roadmap for trading strategies.
-
Set Entry and Exit Points: Breakout patterns can signal opportune moments to initiate trades, while continuation patterns offer indications for potential profit-taking points.
-
Manage Risk: Patterns can assist in determining stop-loss and take-profit levels, enabling traders to manage risk effectively.
-
Time the Market: Patterns provide clues about the timing of market moves, allowing traders to anticipate price movements and capitalize on market fluctuations.
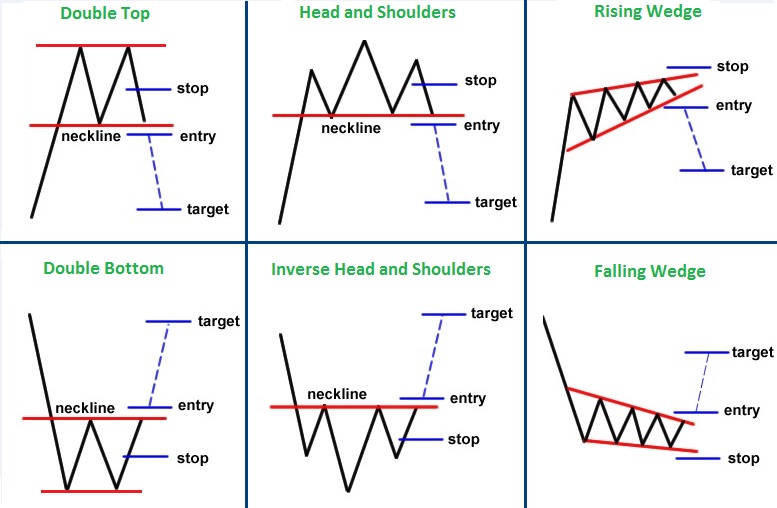
Image: www.aimarrow.com
Technical Analysis Graph Patterns
Conclusion
Technical analysis graph patterns are veritable beacons of guidance for savvy traders. By deciphering these patterns, investors gain a profound comprehension of market dynamics and an advantage in the relentless pursuit of financial success.
However, it is imperative to emphasize that technical analysis is not an exact science. It requires meticulous execution and a comprehensive understanding of its principles. By embracing a diligent approach, traders can leverage the wisdom gleaned from graph patterns to navigate the volatile seas of the financial markets, steering their investments towards uncharted horizons of profitability.


