

Introduction
In the ever-evolving realm of financial markets, technical indicators serve as indispensable tools for traders seeking to distill complex market data into actionable insights. Among these indicators, the Rate of Change (ROC) stands out as a versatile tool designed to gauge market momentum and identify potential trading opportunities. Mastering the art of utilizing the ROC indicator can empower traders with a valuable edge in navigating the dynamic forex market. This comprehensive guide delves into the intricacies of the ROC indicator, exploring its underlying concepts, practical applications, and strategies for harnessing its power in the pursuit of profitable trades.

Image: forexmt4systems.com
What is the ROC Indicator?
The Rate of Change (ROC) indicator is a momentum oscillator that measures the percentage change between the current closing price and the closing price a specified number of periods in the past. This calculation provides insights into the velocity of price movement, enabling traders to assess whether a trend is accelerating, decelerating, or reversing. The ROC indicator is typically plotted as a line below the price chart, with positive values indicating an uptrend and negative values indicating a downtrend.
Formulating Trading Strategies with the ROC Indicator
The ROC indicator finds myriad applications in the formulation of trading strategies. By pinpointing areas of overbought or oversold conditions, it can assist traders in identifying potential reversal points. Additionally, divergences between the ROC indicator and price action can signal potential trend changes.
1. Establishing Overbought and Oversold Parameters
Extreme values of the ROC indicator can suggest overbought or oversold market conditions. When the ROC reaches a predefined overbought threshold, it can indicate that a price correction or reversal is imminent. Conversely, when the ROC falls below an oversold threshold, it can signal a potential buying opportunity.
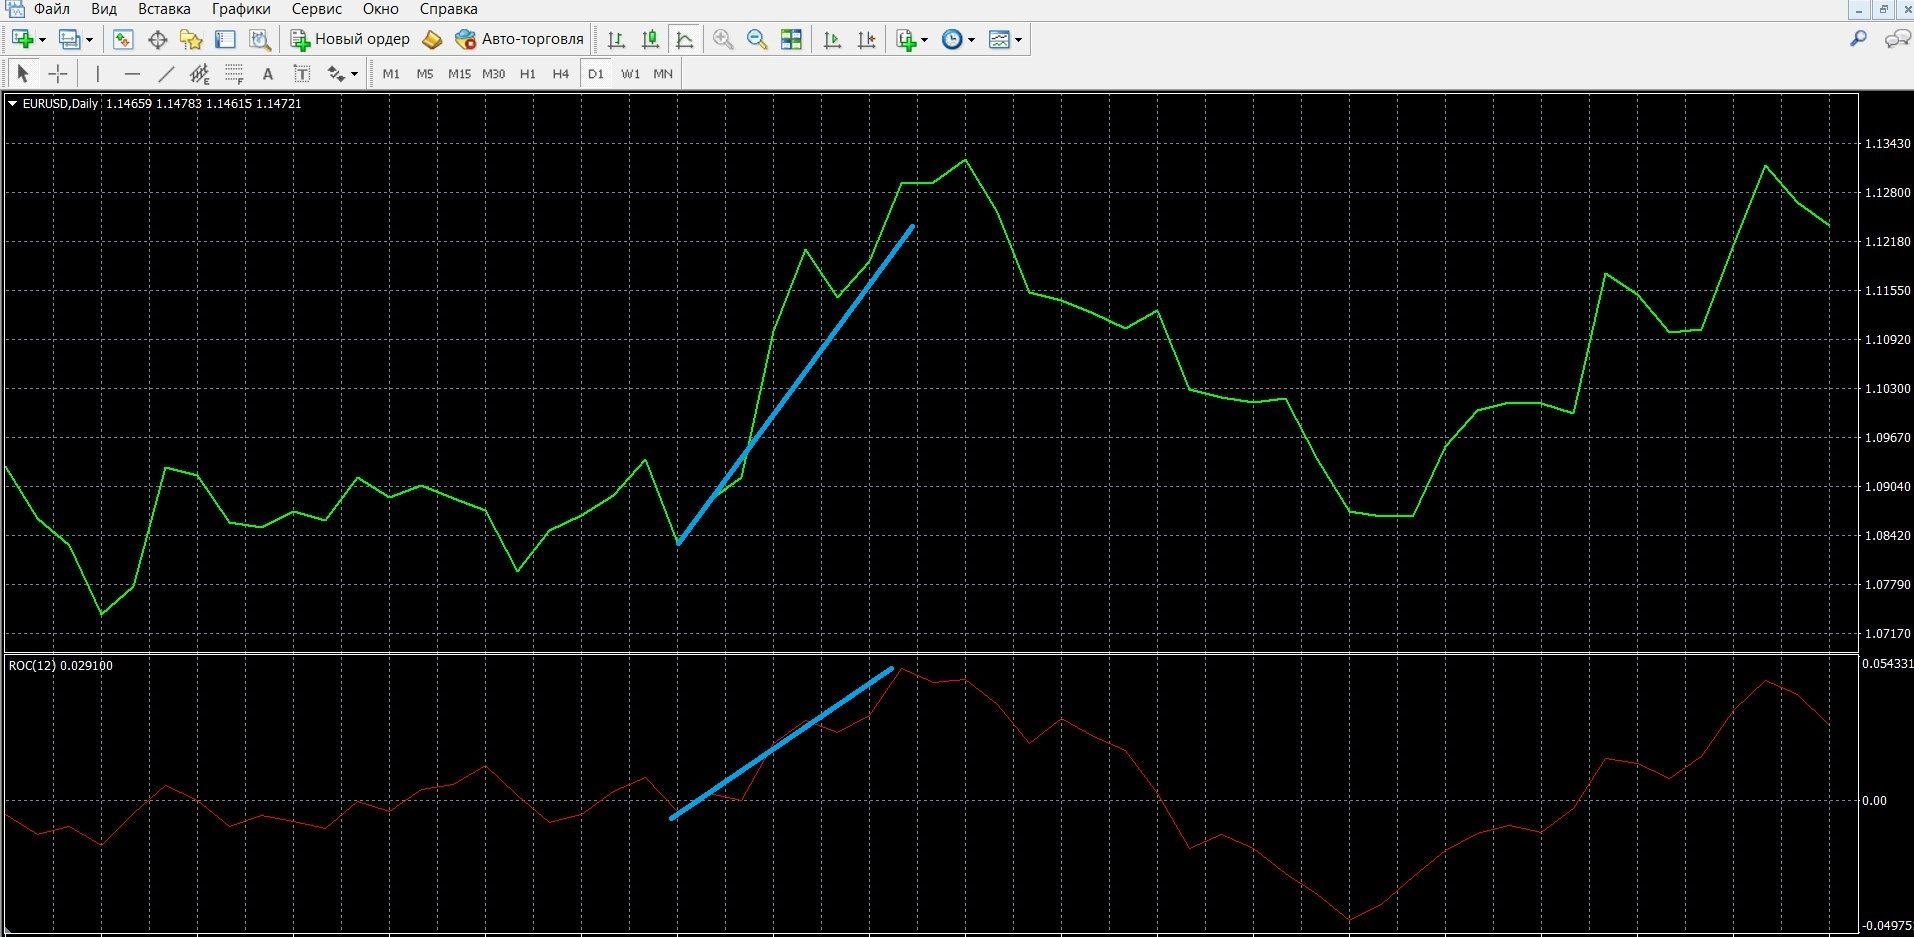
Image: www.investmagnates.com
2. Detecting Divergences with Price Action
Divergences between the ROC indicator and price action can provide valuable insights into potential trend changes. When the ROC indicator signals a bullish trend while price action is moving sideways or declining, it suggests a hidden bullish divergence that can herald an impending price increase. Similarly, when the ROC indicator signals a bearish trend while price action is moving sideways or increasing, it signifies a hidden bearish divergence that can precede a reversal to the downside.
Combining the ROC Indicator with Other Technical Indicators
For enhanced accuracy and reliability, traders often combine the ROC indicator with other technical indicators. Some popular combinations include:
1. ROC and Moving Average Convergence Divergence (MACD)
Combining the ROC indicator with the MACD can provide a more comprehensive view of market momentum. When the ROC crosses above the MACD line, it can signal an upswing in momentum and a potential buying opportunity. Conversely, when the ROC crosses below the MACD line, it can indicate a downswing in momentum and a potential selling opportunity.
2. ROC and Relative Strength Index (RSI)
Utilizing the ROC indicator in conjunction with the RSI can enhance overbought and oversold analysis. When both the ROC and RSI are in overbought territory, it suggests a high probability of a market reversal to the downside. Conversely, when both indicators are in oversold territory, it can signal a potential buying opportunity.
Customizing the ROC Indicator Settings
The ROC indicator offers configurable settings that allow traders to tailor it to their trading styles and market conditions. The most common adjustable parameter is the number of periods over which the rate of change is calculated. Shorter periods, such as 9 or 14 days, provide more sensitive signals but can be prone to whipsaws. Longer periods, such as 21 or 28 days, offer smoother signals but may lag behind price action.
How To Trade With Roc Forex Indicator
Conclusion
Mastering the ROC forex indicator empowers traders with a powerful tool for identifying market momentum, formulating trading strategies, and predicting potential trend changes. By understanding the principles and applications of the ROC indicator, traders can gain a significant advantage in navigating the dynamic forex market. Remember, no technical indicator is foolproof, and sound risk management practices must always be employed to minimize the potential for losses


