

The foreign exchange market, also known as forex, is a vast and dynamic arena that offers countless opportunities for traders of all levels. However, navigating this complex landscape requires a deep understanding of market sentiment and price action. Enter technical analysis, an indispensable tool for forex traders, and one of its most powerful manifestations: graph analysis.

Image: www.tradingview.com
Graph analysis involves studying price patterns on various types of charts to identify trends, support and resistance levels, and potential trade entries and exits. Mastering this skill grants traders a multifaceted advantage, empowering them to make informed decisions and enhance their trading profitability. In this comprehensive guide, we will explore the intricacies of graph analysis, equipping you with the knowledge to uncover market secrets and predict forex movements with greater accuracy.
Unleashing the Power of Graphs: A Trader’s Toolkit
Technical analysis, and graph analysis in particular, relies on the premise that price patterns often repeat themselves, influenced by market psychology and herd behavior. By examining historical price data on graphs, traders can make educated guesses about future price movements.
A myriad of different chart types exists, each offering unique insights into market behavior. Candlestick charts are widely favored for their visual appeal and wealth of information they convey. They represent four data points for each trading period: opening, closing, high, and low prices. These candle formations create patterns that reveal market sentiment and can indicate potential trading opportunities.
Other notable chart types include line charts, which show a continuous line connecting closing prices, and bar charts, which depict the high, low, opening, and closing prices of a trading period as vertical lines. Traders can mix and match different chart types and experiment with various time frames to find the combination that suits their trading style and the specific currency pair they’re analyzing.
Delving into Graph Analysis Techniques
To harness the full potential of graph analysis, traders must familiarize themselves with specific techniques that aid in identifying chart patterns, assessing support and resistance levels, and estimating price targets. Let’s dive into the key concepts:
-
Trend Lines: Trend lines connect a series of higher highs or lower lows in a price chart. They serve as visual representations of the underlying trend and help traders identify potential support or resistance levels.
-
Support and Resistance Levels: Support levels are price points below which the market has historically bounced back while resistance levels are above which the market has faced difficulty rising. These levels offer valuable insights into market equilibrium and potential price reversals.
-
Chart Patterns: Chart patterns, such as triangles, flags, and channels, provide visual cues about potential market movements and trading opportunities. Each pattern has its unique characteristics and rules for interpretation.
-
Fibonacci Retracements:Fibonacci retracements are horizontal lines drawn at specific percentages (such as 38.2%, 50%, and 61.8%) from a prior swing high to a swing low. They can help traders identify potential areas of support and resistance and predict target profit levels.
-
Moving Averages: Moving averages are technical indicators that smooth out price data and filter out market noise. They provide a clear representation of the average price movement over time and can help traders spot trends and stay on the right side of the market.
Putting Graph Analysis into Practice: A Step-by-Step Guide
Equipped with a solid understanding of the key concepts, let’s delve into a step-by-step guide for applying graph analysis to your forex trading:
-
Identify the Trend: Begin by determining the prevailing market trend. Uptrends are characterized by higher highs and higher lows, while downtrends exhibit the opposite.
-
Plot Support and Resistance Levels: Look for areas where the price has bounced off consistently. These levels often act as support or resistance, guiding future price movements.
-
Search for Chart Patterns: Study the price chart for recognizable chart patterns, such as triangles, flags, or head and shoulders. These patterns offer insights into potential price reversals, continuations, or breakouts.
-
Utilize Fibonacci Retracements: Identify key swing points and draw Fibonacci retracement levels to pinpoint areas of potential support or resistance and estimate target points.
-
Confirm with Moving Averages: Use moving averages to confirm the trend and identify potential trend changes. Moving averages can also act as dynamic support or resistance levels, providing additional confirmation for trading decisions.
-
Manage Risk: Graph analysis provides valuable information for identifying potential trading opportunities. Remember to implement strict risk management practices, such as setting appropriate stop-loss and take-profit orders, to protect your capital.
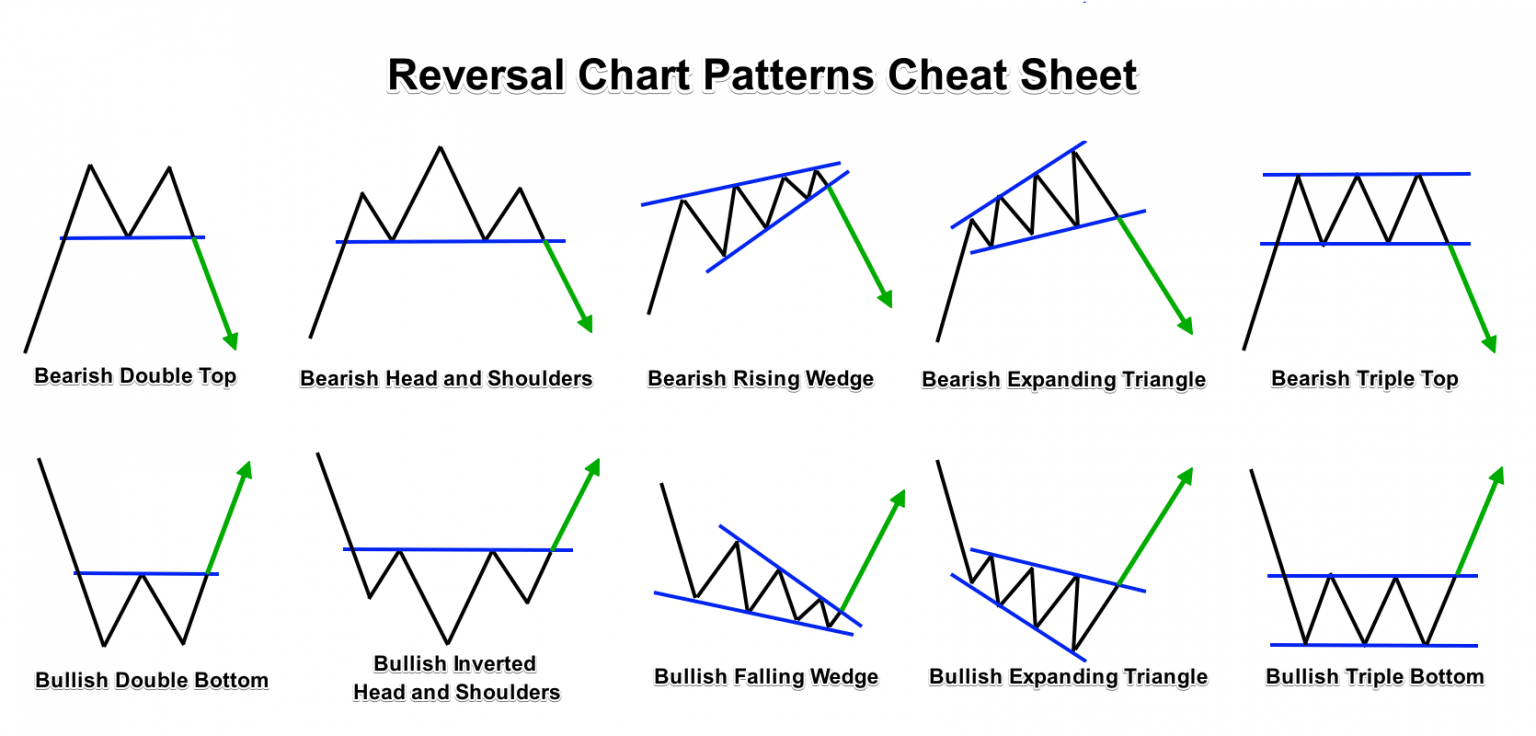
Image: www.forex.academy
How To Predict Forex Using Graphs
Conclusion
Graph analysis has proven to be an indispensable tool in the forex trader’s arsenal, enabling them to navigate the market’s complexities and uncover potential trading opportunities with greater accuracy. By mastering this art, you open the door to a world of profitable trading possibilities, empowering you to predict future market movements


