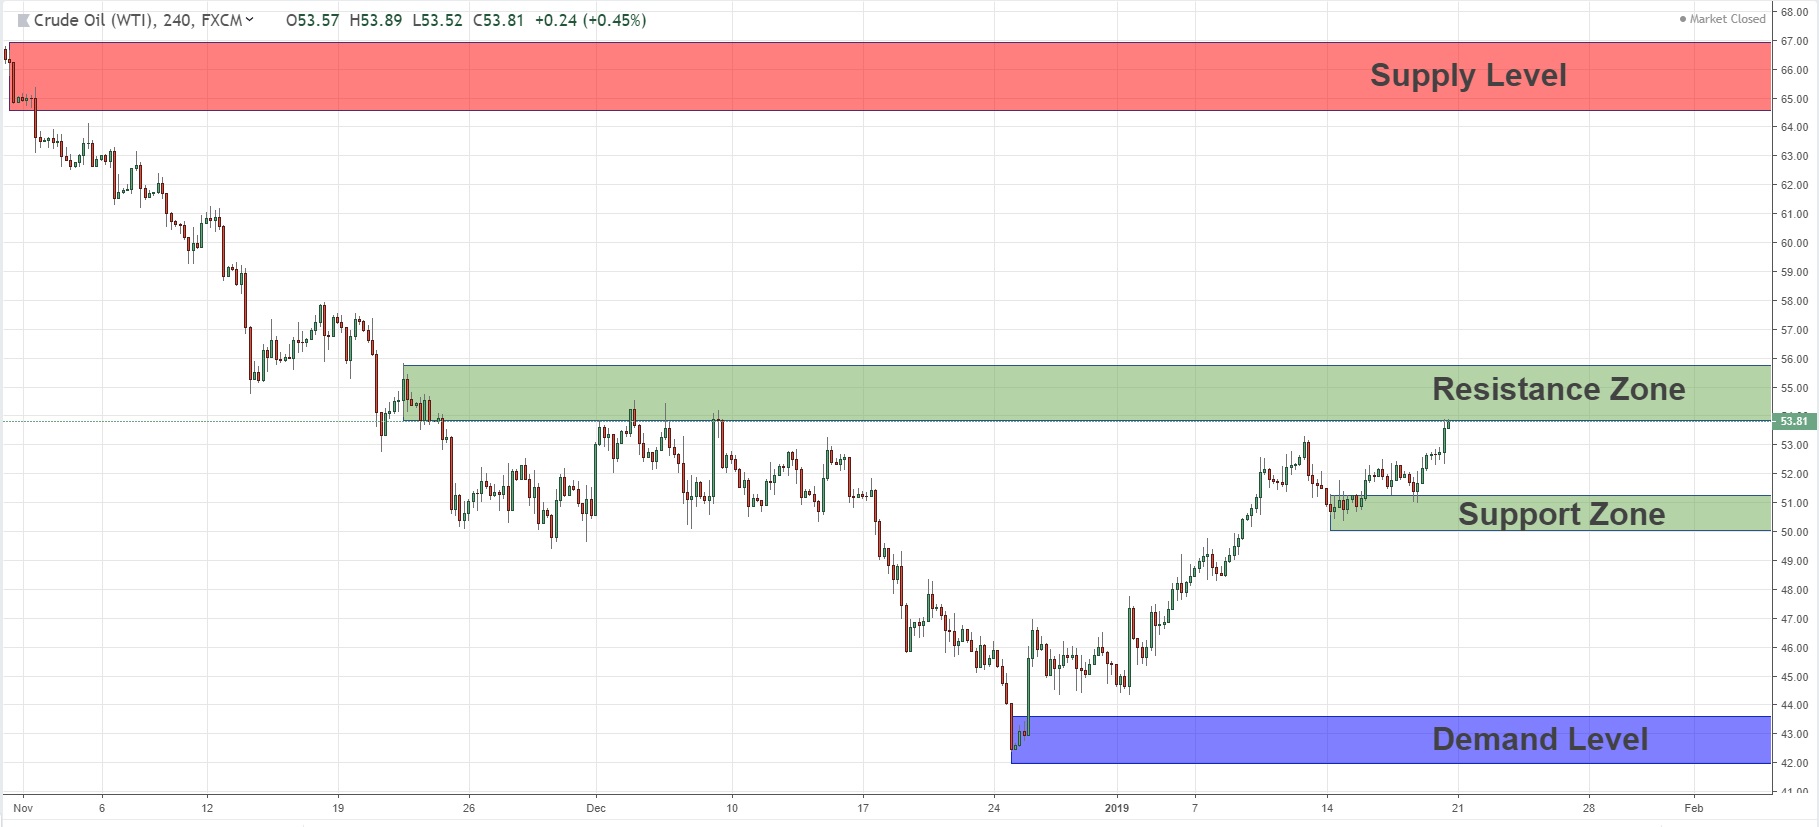
In the dynamic world of forex trading, understanding key levels is paramount. These levels act as crucial support and resistance zones, guiding traders in making informed trading decisions. Drawing major key levels in forex involves identifying areas where price action tends to react and reverse. By recognizing these levels, traders can increase their chances of profiting from market trends and mitigating potential losses.

Image: the5ers.com
There are various methods for drawing major key levels in forex. This article will explore some of the most effective techniques, providing traders with a comprehensive guide to this essential skill.
Horizontal Key Levels
Horizontal key levels are drawn by connecting areas of significant price turning points. These levels represent levels at which price has consistently reversed in the past, indicating the presence of underlying support or resistance.
To draw horizontal key levels, follow these steps:
- Identify price swings: Look for areas where price has reversed from a downtrend to an uptrend or vice versa.
- Connect turning points: Draw a horizontal line connecting at least two significant turning points created by these price swings.
- Validate levels: Test the drawn levels by observing how price reacts when it reaches them. If price bounces off the level multiple times, it indicates the level’s validity.
Moving Averages
Moving averages (MAs) are technical indicators that smooth out price action by calculating the average price over a specified period. MAs can act as key levels, providing traders with dynamic support and resistance lines.
To use MAs as key levels, consider the following:
- Trend identification: An upward-sloping MA suggests an uptrend, while a downward-sloping MA indicates a downtrend.
- Support and resistance: The MA can act as a support level during an uptrend and a resistance level during a downtrend.
- Crossovers: When the price crosses below the MA, it can signal a sell signal, while a crossover above the MA can indicate a buy signal.
Fibonacci Levels
Fibonacci levels are based on the Fibonacci sequence, a naturally occurring mathematical sequence. Fibonacci levels represent significant retracement and extension points in price action, offering traders potential key levels for support and resistance.
To draw Fibonacci levels, you can use the following steps:
- Identify swing points: Locate a recent significant swing low and swing high.
- Calculate retracement levels: Use the following ratios to draw Fibonacci retracement levels: 23.6%, 38.2%, 50%, 61.8%, and 78.6%.
- Validate levels: Observe how price reacts when it reaches Fibonacci levels. If price tends to reverse or consolidate at these levels, it strengthens their significance.

Image: www.mql5.com
Chart Patterns
Chart patterns are distinctive formations on price charts that often indicate future price movements. Traders can use chart patterns to identify potential key levels for support and resistance.
Common chart patterns that serve as key levels include:
- Double tops and bottoms
- Head and shoulders
- Triangles
- Flags and pennants
By recognizing these chart patterns and understanding how price tends to move within them, traders can anticipate potential key levels and adjust their trading strategies accordingly.
How To Draw Major Key Levels In Forex
Conclusion
Drawing major key levels in forex is a crucial skill for traders to master. By employing the techniques outlined in this article, traders can identify areas where price action tends to pause or reverse. This understanding provides valuable guidance for making informed trading decisions and developing a robust trading strategy. Remember to practice these techniques regularly and validate the levels through price action analysis to enhance your overall trading performance.


