

Introduction
_.jpg/1b2eec978475913b4e0eafc452812d65.jpg "Unveiling the Market’s Mood – A Comprehensive Guide to the Volatility Index (VIX)")
Image: www.valuethemarkets.com
Have you ever watched the stock market fluctuate wildly, leaving you feeling uncertain about the future? Enter the Volatility Index, or VIX, a crucial barometer that measures the market’s fear and greed, providing invaluable insights into potential risks and opportunities.
The VIX is a real-time indicator that captures the expected volatility of the S&P 500 index over the next 30 days. When the VIX is high, it suggests investors are anxious about the market’s direction, preparing for significant price movements. Conversely, a low VIX indicates a market perceived as stable and predictable.
Deep Dive into the Volatility Index
-
History and Evolution: The VIX was first introduced in 1993 by the Chicago Board Options Exchange (CBOE) and has since become the go-to indicator for market volatility.
-
Calculation: The VIX is calculated using complex mathematical models that analyze the prices and implied volatility of S&P 500 index options. Volatility is expressed as an annual percentage rate, reflecting the magnitude of price fluctuations investors expect.
-
Significance: The VIX plays a critical role in risk management and investment decisions, providing a forward-looking perspective on market volatility. It helps investors gauge potential risks, plan hedging strategies, and make informed trading choices.
-
Trends and Developments: Over time, the VIX has exhibited distinctive patterns. During economic downturns or periods of uncertainty, the VIX tends to surge, signaling heightened anxiety among investors. In contrast, during periods of stability and growth, the VIX often remains subdued.
-
Limitations: While the VIX is a valuable tool, it’s essential to note its limitations. The VIX measures anticipated volatility, not actual volatility, and it can be susceptible to short-term spikes or drops.
Expert Insights and Actionable Tips
-
Expert Advice: According to market analyst Mike Wilson, “The VIX provides a forward-looking perspective on the market’s fear gauge. It can be used as a sentiment indicator to gauge investor confidence and nervousness.”
-
Practical Application: Investors can use the VIX to inform their investment strategies. A high VIX may warrant caution and defensive measures, while a low VIX could indicate potential opportunities for higher returns.
-
Be Aware of Market Anomalies: Market anomalies can sometimes cause the VIX to deviate from its typical behavior. For instance, a persistent low VIX may coincide with a period of heightened risk that the VIX has yet to capture.
Conclusion
The Volatility Index (VIX) is an indispensable tool that unlocks the market’s hidden risks and opportunities. By understanding how the VIX works, investors can gain invaluable insights into the market’s mood, navigate volatility with confidence, and make informed decisions that maximize their returns. Remember, while the VIX is a powerful indicator, it should be used alongside other analysis techniques for a comprehensive market assessment. Embracing the VIX’s insights will empower you to stay one step ahead in the ever-evolving financial landscape.
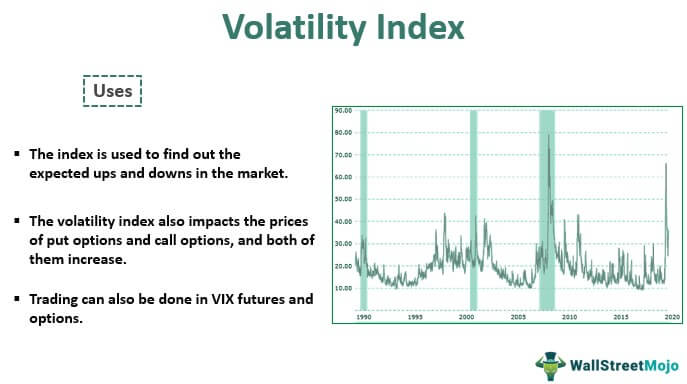
Image: www.wallstreetmojo.com
What Is The Volatility Index


