

Navigating the tumultuous waters of forex trading requires a keen eye for market movements and a strategic approach to identifying potential trading opportunities. One powerful technique that has proven its worth in the forex arena is the divergence strategy, a tool employed by seasoned traders to seize profits from price and momentum misalignments. In this comprehensive guide, we will delve into the world of forex divergence strategy, using the widely acclaimed Relative Strength Index (RSI) as our compass.

Image: admiralmarkets.com
The RSI, a momentum indicator, measures the magnitude of recent price changes to gauge whether an asset is overbought or oversold. When the RSI oscillates above 70, it signals potential overbought conditions, while readings below 30 suggest oversold markets. Divergence, in this context, occurs when the RSI’s trajectory diverges from the price action, indicating a potential reversal or continuation of a trend.
Bullish Divergence: A Ray of Hope for Uptrends
Bullish divergence unfolds when the RSI forms a higher low while the price action prints a lower low, creating a positive divergence. This configuration suggests that the downside momentum is waning despite the price declines, indicating a potential uptrend reversal. As the RSI rises, it signals increasing buying pressure, and when combined with the lower low in price, it forms a bullish divergence pattern.
Traders may opt to enter a long position upon confirmation of the divergence. Stop-loss placement can be set below the recent price low, and profit targets can be set at resistance levels or key technical indicators such as moving averages. Identifying bullish divergence patterns can empower traders to capitalize on potential trend reversals and capture upward momentum in the market.
Bearish Divergence: A Cautionary Sign for Downtrends
Bearish divergence manifests when the RSI establishes a lower high while the price action records a higher high, forming a negative divergence. This pattern suggests dwindling upside momentum despite the price increases, potentially signaling a trend reversal or continuation. As the RSI descends, it indicates waning buying pressure, and coupled with the price’s higher high, it forms a bearish divergence pattern.
Traders may choose to initiate a short position when bearish divergence is detected. Stop-loss orders can be placed above the most recent price high, and profit targets can be set at support levels or technical indicators like moving averages. Recognizing bearish divergence patterns equips traders with the ability to profit from potential downtrend reversals and capitalize on downward market momentum.
Empowering Insights from the RSI Divergence Strategy
The RSI divergence strategy, when implemented effectively, can provide valuable insights into potential price reversals or trend continuations. As an indispensable tool in the arsenal of seasoned traders, it offers a glimpse into the underlying momentum dynamics of the market. By identifying divergence patterns, traders can anticipate impending market shifts and position themselves accordingly, increasing their chances of profitable outcomes.
The RSI divergence strategy’s effectiveness stems from its ability to capture market sentiment swings. As prices fluctuate, the RSI gauges the strength of the prevailing trend and reveals instances where momentum and price action diverge. This divergence serves as an early warning system, providing traders with an edge in identifying potential turning points in the market.
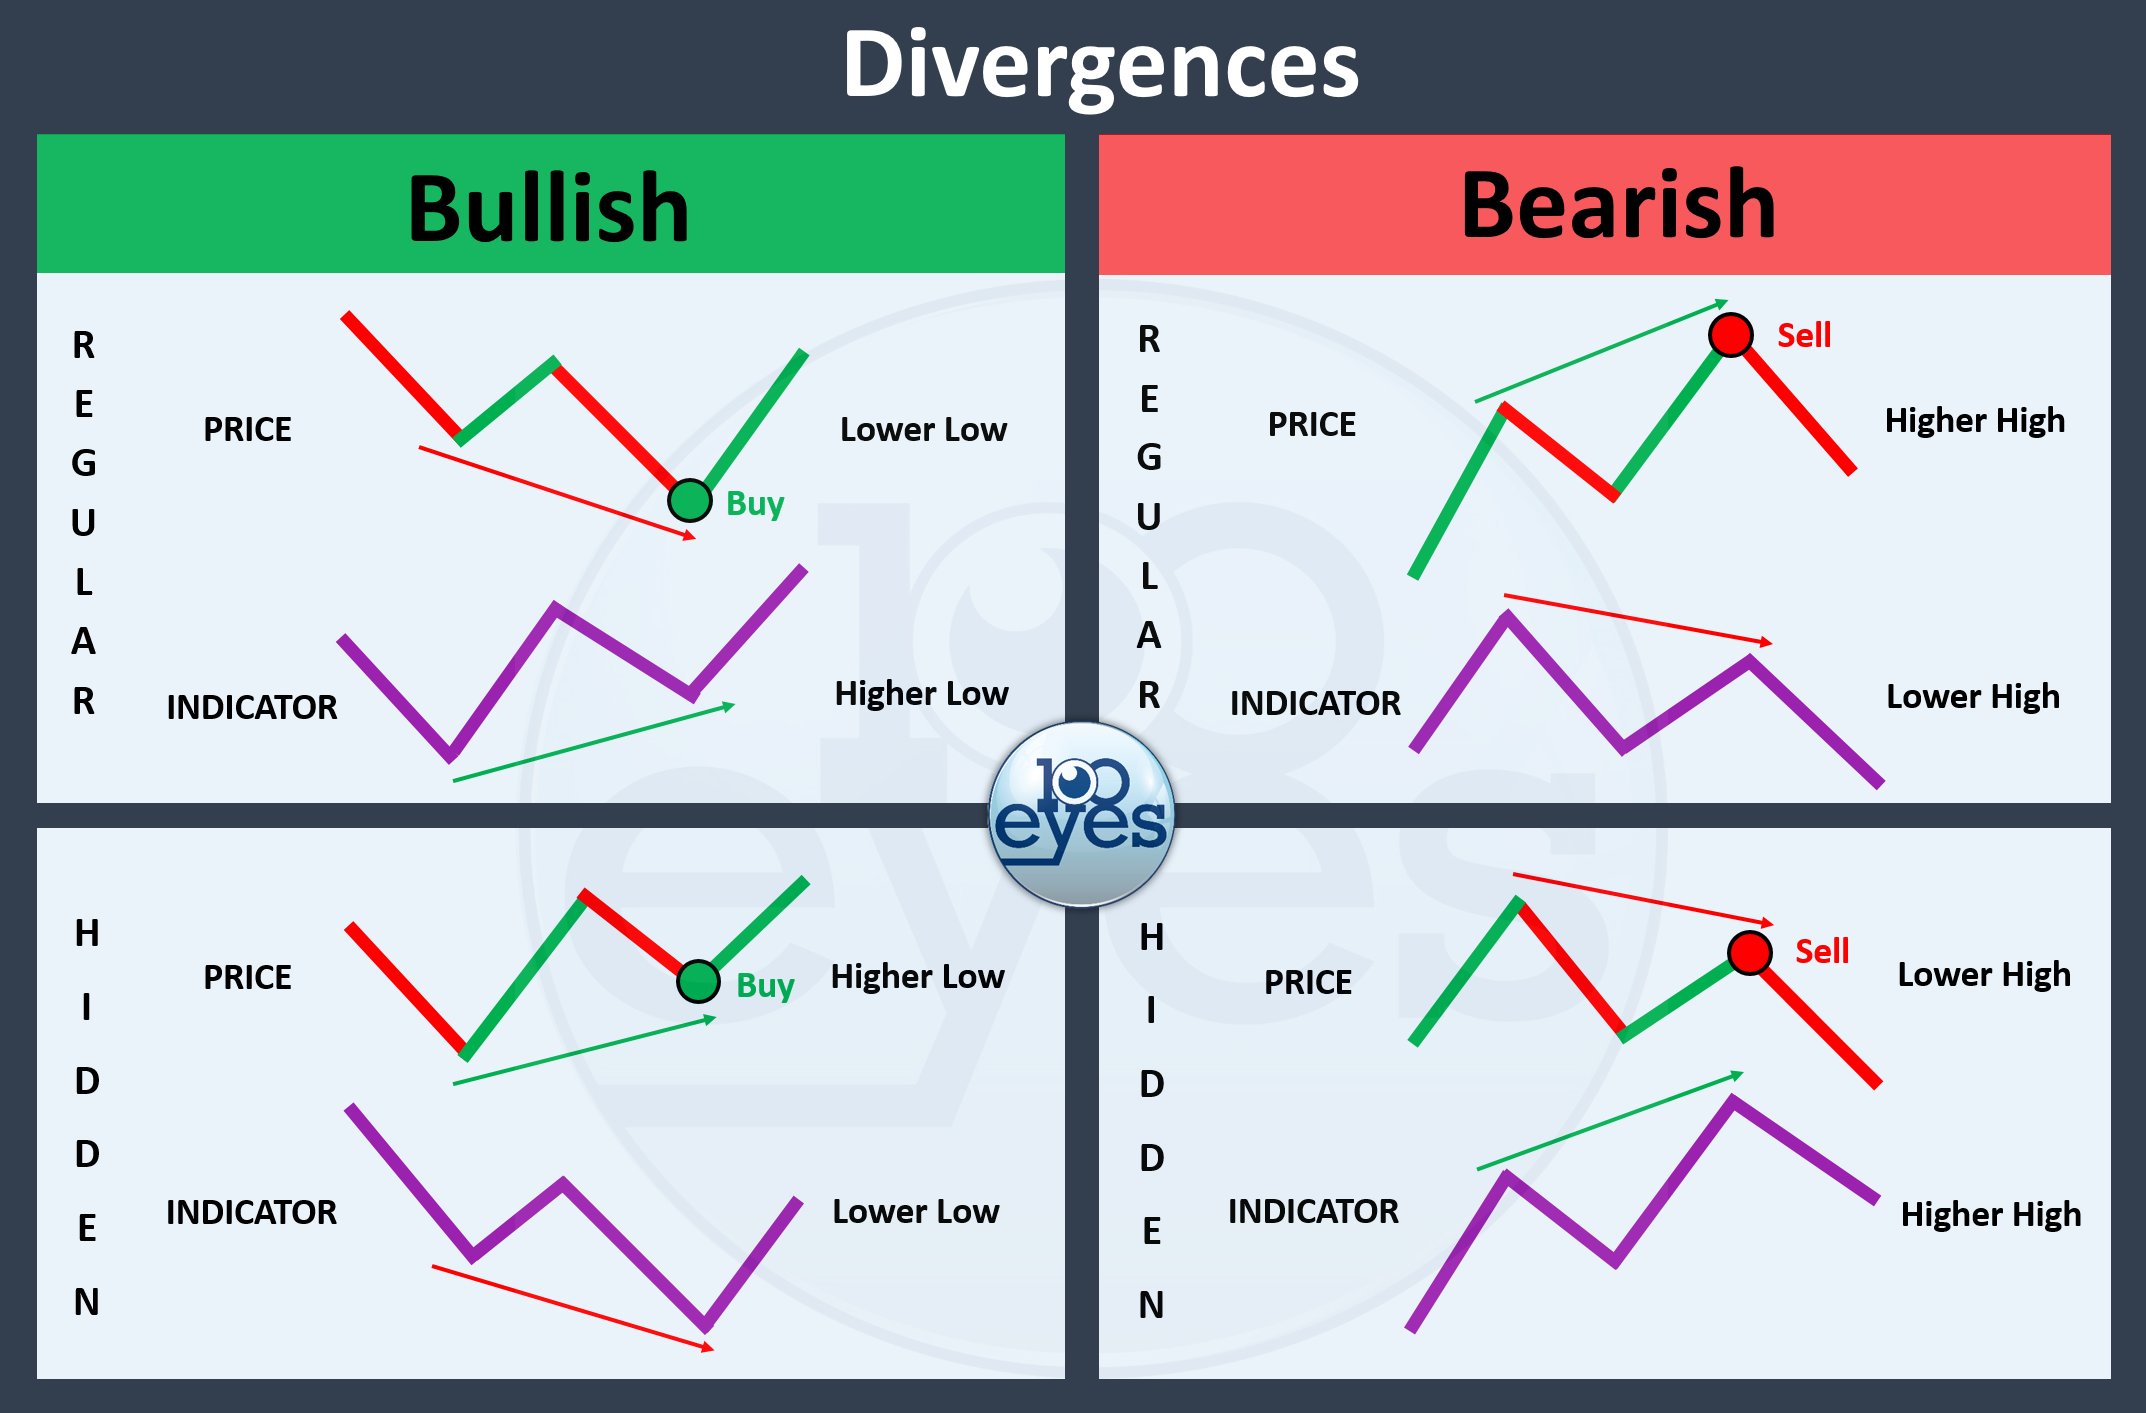
Image: mungfali.com
Expert Advice: Maximizing the RSI Divergence Strategy
To harness the full potential of the RSI divergence strategy, consider these expert tips:
- Confirm Divergence Patterns: Avoid impulsive trades based solely on a single divergence signal. Verify the divergence with other technical indicators or chart patterns to enhance your confidence.
- Contextualize Market Conditions: The significance of divergence patterns varies depending on the overall market context. Assess the broader trend, market sentiment, and other technical indicators for a comprehensive understanding.
Frequently Asked Questions: Unraveling the Mysteries of Divergence
Q: Can the RSI divergence strategy be used on any timeframe?
A: While divergence patterns can emerge on any timeframe, traders often favor higher timeframes such as 4-hour or daily charts for more reliable signals.
Q: Is the RSI divergence strategy a foolproof indicator?
A: No technical indicator is fail-safe, and divergence patterns should be interpreted in conjunction with other market factors. Confirmation from multiple sources enhances trading decisions.
Forex Divergence Strategy With Rsi
Conclusion: Embracing the Power of Divergence
The RSI divergence strategy is a valuable tool for forex traders seeking to identify potential market reversals or continuations. By discerning the misalignment between price action and momentum, traders can gain an edge in navigating the dynamic forex market. Combining the RSI divergence strategy with other technical indicators and sound risk management practices can further enhance your trading outcomes. Embracing this powerful strategy can empower you to make informed trading decisions and potentially maximize your profits.
So, are you ready to embark on the exciting journey of using the RSI divergence strategy in your forex trading endeavors? The world of trading awaits your exploration, and with the guidance of this comprehensive guide, you can confidently step into the arena and seize the opportunities that lie ahead. Happy trading!


