

Many traders dip their toes into the enigmatic world of forex without fully grasping the significance of forex charts. These visual representations of currency price movements hold the power to unravel market patterns, forecast future trends, and guide your trading strategies. Understanding forex charts with technical indicators can transform you from a novice into a savvy trader, enabling you to make educated decisions that maximize your trading potential.

Image: nl.pinterest.com
Anatomy of a Forex Chart:
A forex chart displays the historical and real-time fluctuations of currency pairs, depicting an intuitive graph of the market’s behavior. The x-axis indicates time, while the y-axis represents the exchange rate between the two currencies. Each point on the chart signifies a trade executed at that particular price and time. By deciphering these charts, you gain valuable insights into the market’s pulse, allowing you to identify trends, spot patterns, and anticipate price movements. However, capturing the full benefits of forex charts requires an understanding of technical indicators.
Technical Indicators: A Trader’s Toolkit:
Technical indicators are mathematical calculations that analyze price data to generate signals, identify trends, and measure momentum. These instruments extend the capabilities of forex charts, providing objective insights that can enhance your trading strategies. Some widely used technical indicators include Moving Averages, Bollinger Bands, Relative Strength Index (RSI), Moving Average Convergence Divergence (MACD), and Ichimoku Kinko Hyo. Each indicator provides unique insights, helping traders gauge market conditions, identify potential trading opportunities, and manage risk.
Harnessing Forex Charts and Technical Indicators:
Interpreting forex charts in tandem with technical indicators empowers you with a comprehensive market analysis framework. For instance, moving averages smooth out price data and help identify overall market trends. Bollinger Bands create an envelope around the price movement, assisting in determining overbought and oversold conditions. RSI measures the strength of market momentum and can signal potential trend reversals. MACD uses a histogram to depict discrepancies between two moving averages, indicating potential trading opportunities. Ichimoku Kinko Hyo, a comprehensive indicator, combines multiple elements to predict price direction, support and resistance levels, and market momentum.
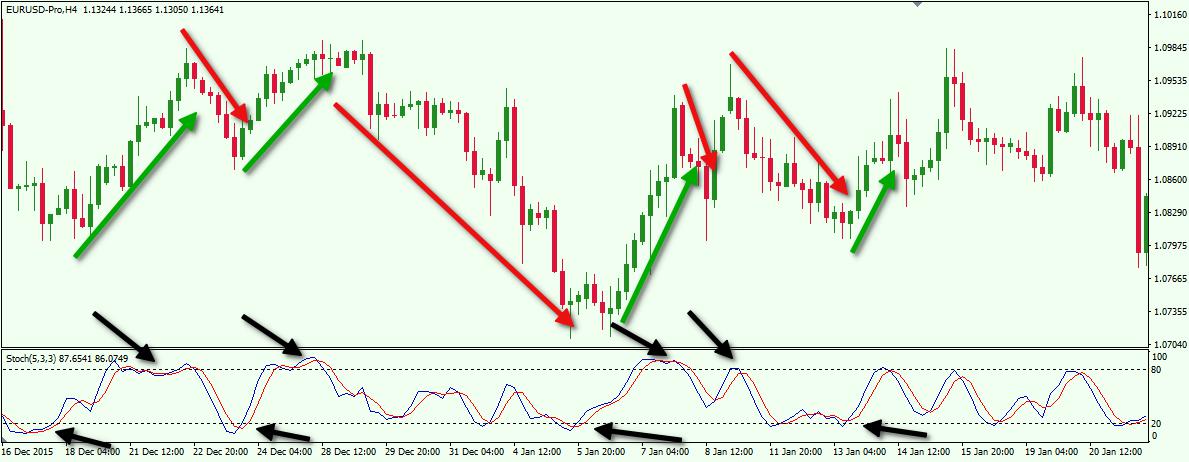
Image: forextraininggroup.com
Leveraging Forex Chart Patterns:
Forex charts often exhibit patterns that reveal recurring market behaviors. Double tops and bottoms, head and shoulders, wedges, and flags are archetypal patterns that help traders predict future price movements. By familiarizing yourself with these formations, you can anticipate market trends and position your trades accordingly. Technical indicators augment this pattern recognition process, providing corroborating signals for increased trading confidence.
Risk Management with Forex Charts and Technical Indicators:
Forex trading, while potentially rewarding, carries inherent risk. Forex charts and technical indicators serve as crucial tools for managing risk and safeguarding your capital. Spotting overbought and oversold conditions with Bollinger Bands or RSI assists in avoiding potential traps. Identifying market reversals using MACD or Ichimoku Kinko Hyo can help you exit trades and minimize losses. By incorporating technical indicators into your trading strategy, you gain a heightened awareness of market volatility and can adjust your risk exposure accordingly.
Forex Chart With Technical Indicators
Conclusion:
Forex charts, coupled with technical indicators, unlock a wealth of market information, guiding your trading decisions towards profitability. Understanding forex chart patterns and the intricacies of technical indicators is the key to unlocking the market’s secrets and achieving trading success. Embark on this knowledge-seeking journey, harness the power of technical analysis, and witness your forex trading transformed from blind speculation into an informed and rewarding endeavor.


