

Introduction
In the realm of financial markets, where precision and predictability are paramount, technical analysis emerges as an invaluable tool. Among the arsenal of charting techniques, Fibonacci analysis stands tall as a time-tested and remarkably effective approach to identifying market behavior and predicting future price movements. Dive into this comprehensive guide and master the secrets of Fibonacci technical analysis, empowering yourself for profitable trading decisions in forex and stock markets.
Fibonacci in Technical Analysis: Unveiling the Golden Ratio
The Fibonacci sequence, discovered by the renowned Italian mathematician Leonardo Pisano Fibonacci, is a unique numerical pattern where each term is the sum of the immediately preceding two terms. In technical analysis, this sequence becomes an instrumental indicator when applied to price movements. Fibonacci retracement levels, extensions, and time zones are key components drawn from this powerful tool.

Image: www.colourhaze.de
Retracement Levels: Roadmaps to Price Pullbacks
Fibonacci retracement levels delineate potential support and resistance zones during price pullbacks within an uptrend or downtrend. These levels represent percentages of the previous trend’s range, with key levels placed at 23.6%, 38.2%, 50.0%, 61.8%, and 78.6%. Understanding retracement levels can assist traders in identifying price dips and potential entry points for reversal trades.
Extensions: Navigating Price Targets
Fibonacci extensions project potential price targets beyond the retracement levels. These extensions serve as guideposts for where a trend might extend or reverse. Common extension levels are 100.0%, 138.2%, 161.8%, and 200.0% of the previous trend’s range. By identifying these extensions, traders can anticipate potential profit targets and plan their trades accordingly.
Time Zones: Synchronizing Market Rhythms
Fibonacci time zones help traders predict turning points and market reversals based on the duration of previous price swings. These time zones are derived from the Fibonacci sequence and demarcate potential areas of support, resistance, or trend changes. By superimposing time zones on price charts, traders can pinpoint trading opportunities that align with market cycles.
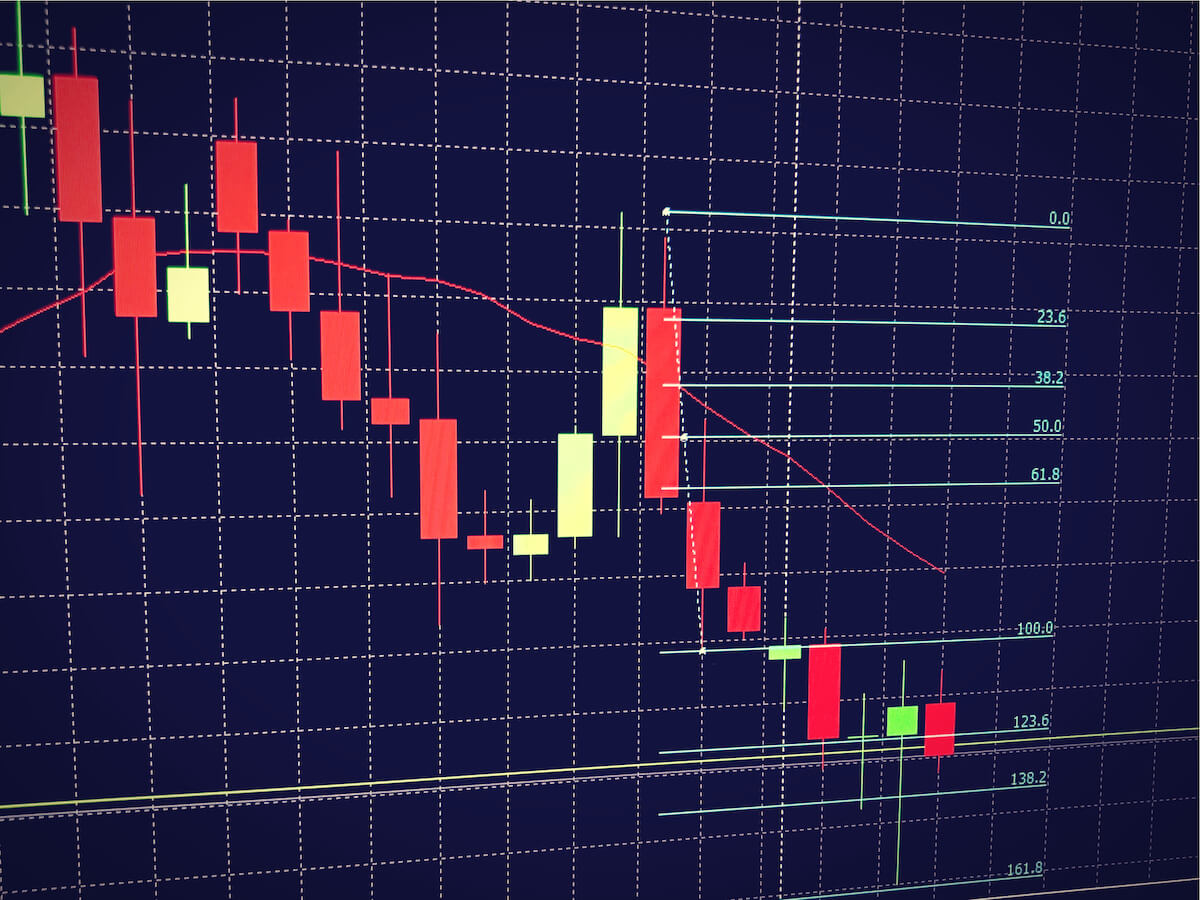
Image: www.forex.academy
Case Study: Fibonacci Success in Forex Trading
Consider an example from the EUR/USD currency pair. After a strong uptrend, the price retraces to the 38.2% Fibonacci retracement level. Recognizing this support zone, a trader anticipates a potential reversal. As the price bounces off this level, they enter a long position with a stop-loss below the 38.2% level and a take-profit target near the 61.8% Fibonacci extension. The trade successfully profits as the price resumes its uptrend.
Practical Tips for Fibonacci Mastery
- Use Fibonacci tools in conjunction with other technical indicators for a comprehensive trading strategy.
- Seek confluence between Fibonacci levels and other indicators (such as moving averages, support/resistance) for increased reliability.
- Remember that Fibonacci analysis is a probability tool, not a crystal ball. Manage expectations and use it in harmony with risk management strategies.
- Practice extensively on demo accounts before deploying real capital.
- Continuously refine your Fibonacci trading skills through research and analysis.
Fibonacci Technical Analysis Skills For Forex & Stock Trading
Conclusion
Fibonacci technical analysis is a valuable skill for aspiring and seasoned traders alike. By understanding and applying Fibonacci retracement levels, extensions, and time zones, traders can uncover trading opportunities, pinpoint price targets, and anticipate trend reversals. Remember, the key to successful Fibonacci trading lies in a blend of technical expertise, disciplined risk management, and an unwavering commitment to continuous learning. Embrace the power of Fibonacci analysis and unlock the potential for increased profitability in forex and stock trading.


