

Introduction
In the realm of forex trading, the Moving Average Convergence Divergence (MACD) indicator stands as a beacon of guidance, helping traders navigate market fluctuations with precision and confidence. Renowned for its ability to identify trends, momentum, and potential trading opportunities, the MACD has earned its place as an indispensable tool in the arsenal of every seasoned trader. In this comprehensive guide, we will delve into the nuances of the MACD, exploring its history, mechanics, and the pivotal role it plays in successful forex trading.

Image: forexwot.com
Understanding the MACD: A Journey Through Time
Conceptualized by Gerald Appel in the early 1980s, the MACD was designed to measure the relationship between two exponential moving averages (EMAs) of a security’s price. The EMA, a weighted average that assigns more significance to recent prices, provides a smoother representation of price trends compared to traditional moving averages. The MACD is constructed by subtracting the 26-period EMA from the 12-period EMA, creating a line that oscillates above and below zero. This oscillation reveals the convergence and divergence of the two EMAs, providing valuable insights into market momentum.
A Deeper Dive into the MACD’s Components
The MACD is accompanied by two additional components that enhance its analytical capabilities: the signal line and the histogram. The signal line, typically a 9-period EMA of the MACD, acts as a smoother representation of the MACD and aids in identifying potential turning points. The histogram, derived by subtracting the signal line from the MACD, amplifies the divergence between the two EMAs and facilitates the visualization of trend strength and momentum.
Harnessing the Power of the MACD: Expert Insights and Actionable Tips
To fully leverage the potential of the MACD, it is crucial to understand its various interpretations and implications. When the MACD is above zero, it indicates a bullish trend, while a value below zero suggests a bearish trend. Crossovers between the MACD and the signal line provide early warnings of trend reversals, with a bullish crossover occurring when the MACD rises above the signal line and a bearish crossover when it falls below.
Moreover, the histogram serves as a barometer of trend strength, with rising bars indicating increasing momentum and falling bars signaling decreasing momentum. Traders can use this information to identify potential entry and exit points, aiming to enter trades when the MACD and histogram align and exiting when they diverge.
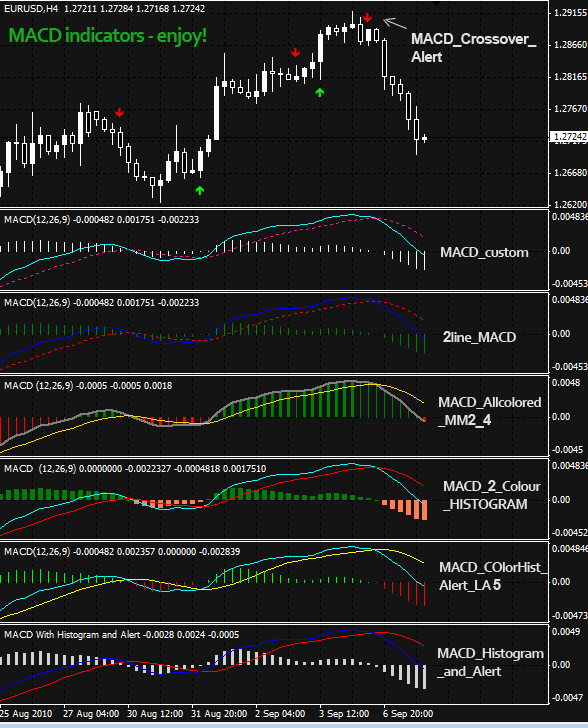
Image: forex-indicators.net
Best Macd For Forex Tpl
Conclusion: The MACD – An Indispensable Ally in Forex Trading
The Moving Average Convergence Divergence indicator is a versatile and powerful tool that has revolutionized the way traders analyze market trends and identify trading opportunities in the foreign exchange market. Its ability to track momentum, reveal potential turning points, and gauge trend strength makes it an invaluable asset for both novice and experienced traders alike. By understanding the intricacies of the MACD, traders can gain a competitive edge and navigate the complexities of the forex market with greater confidence and precision.


