

Imagine the flickering flames of a candle, captivating your senses and guiding your path. Candles have long been objects of intrigue, not only for their aesthetic beauty but also for their profound significance in the world of trading. For centuries, candle charts have played a vital role in empowering traders to decipher market movements and make informed investment decisions.

Image: www.strike.money
Introduction to Candle Charts
Candle charts are graphical representations of price action that provide a visual snapshot of a financial instrument’s movements over a specific period. Each candle comprises several components: the open, high, low, and close prices. The open price represents the price at which the asset opened during the time interval, while the close price signifies its closing value. The high and low prices depict the asset’s highest and lowest points, respectively.
Types of Candlesticks
There are numerous types of candlesticks, each with its unique characteristics. Here are some of the most prevalent:
- Green candle: Indicates an upwards trend with the close price higher than the open price.
- Red candle: Indicates a downwards trend with the close price lower than the open price.
- Doji: Signifies a period of indecision with the open and close prices roughly equal.
- Spinning top: A small candle with a long wick on either side, indicating uncertainty in market direction.
- Hammer: A long upper wick and a small lower wick, indicating a bullish reversal.
- Inverted hammer: A long lower wick and a small upper wick, indicating a bearish reversal.
Patterns and Formations
Candle charts are not only descriptive but also predictive. By analyzing the patterns and formations created by multiple candles, traders can identify recurring market behavior and speculate on future price movements. Some common patterns include:
- Bullish engulfing pattern: A large green candle engulfing a smaller red candle, signaling an upward reversal.
- Bearish engulfing pattern: A large red candle engulfing a smaller green candle, signaling a downward reversal.
- Morning star: A three-candle pattern, starting with a large red candle, followed by a small candle with a lower close, and then a large green candle with a higher close, indicating a bullish reversal.
- Evening star: A three-candle pattern, starting with a large green candle, followed by a small candle with a higher close, and then a large red candle with a lower close, indicating a bearish reversal.
- Three black crows: A series of three consecutive red candles with long lower wicks and short upper wicks, indicating a strong downtrend.
- Three white soldiers: A series of three consecutive green candles with long upper wicks and short lower wicks, indicating a strong uptrend.
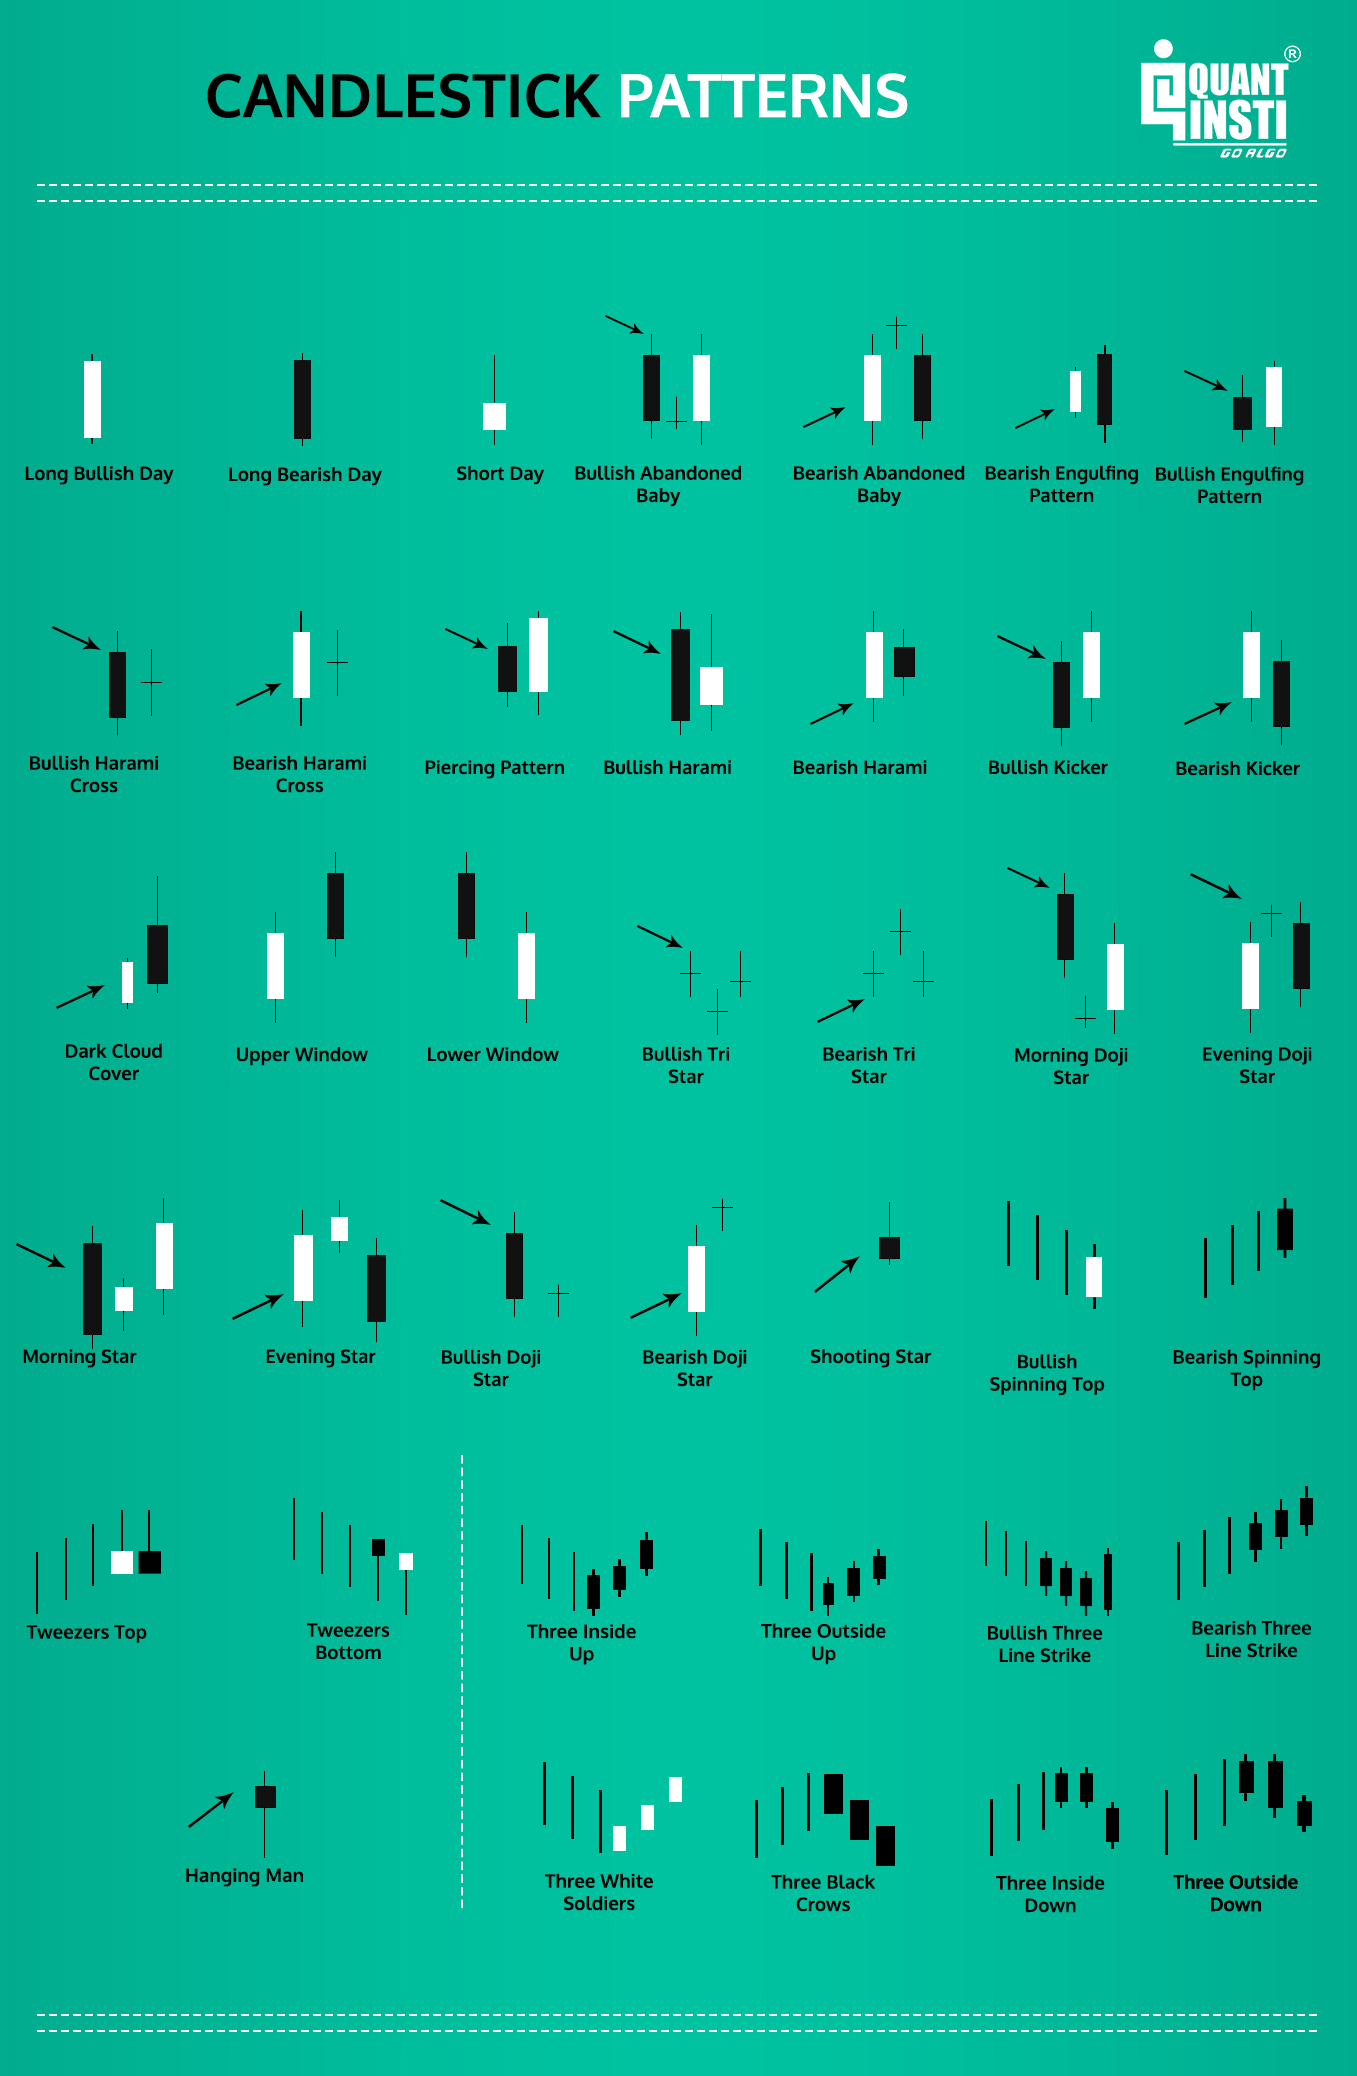
Image: www.hotzxgirl.com
Latest Trends and Technologies
The world of candle trading is constantly evolving, fueled by technological advancements and innovations. Artificial intelligence (AI) and machine learning (ML) are revolutionizing the way traders analyze charts, identify patterns, and make decisions.
Automated trading systems, powered by sophisticated algorithms, are also gaining popularity. These systems scan markets in real-time, execute trades, and adapt to changing conditions, providing traders with a more efficient and objective approach.
Tips and Expert Advice
Becoming a proficient candle trader requires a combination of knowledge, skill, and experience. Here are some tips from seasoned traders:
- Use multiple time frames: Analyze candlesticks on different time scales to gain a comprehensive perspective.
- Identify support and resistance levels: Crucial price zones where markets typically bounce or reverse.
- Confirm signals with other indicators: Combine candlestick analysis with other technical indicators for increased reliability.
- Practice with a demo account: Experiment with different strategies and hone your skills before trading with real money.
- Control emotions: Stay disciplined and avoid making impulsive decisions based on emotions.
- Manage risk effectively: Use stop-loss orders and take appropriate profit targets to protect capital.
FAQ
Q: What is the difference between a bull candle and a bear candle?
A: A bull candle is green, indicating an upwards trend, while a bear candle is red, indicating a downwards trend.
Q: Can candle charts be used for all assets?
A: Yes, candle charts are versatile and can be applied to various assets, including stocks, bonds, commodities, and currencies.
Q: Are all patterns reliable?
A: No, not all patterns are 100% accurate. However, certain patterns have a higher probability of predicting market movements than others.
Q: How often should candlestick charts be used?
A: Candle charts can be used on any time frame, but most traders prefer hourly, daily, or weekly charts for technical analysis.
Q: What are the limitations of candle charts?
A: Candle charts only provide information about price action; they do not take into account other factors that could influence market movements, such as news events or economic data.
Types Of Candles Trading
https://youtube.com/watch?v=nMHjRrm4Yt4
Conclusion
Candle trading is an indispensable technique for traders of all levels. By interpreting the nuanced patterns and formations created by candles, traders can decipher market trends, make informed decisions, and potentially increase their profits. Whether you are a beginner or an experienced trader, embracing candle charts is a valuable step towards mastering the art of trading.
Are you captivated by the allure of predicting market movements? Engage with this article and share your insights on the fascinating world of candle trading.


