

Introduction

Image: kovivygoqabut.web.fc2.com
In the ever-fluctuating world of forex trading, understanding the volatility of financial instruments is paramount to informed decision-making. One key tool in the trader’s arsenal is the Average True Range (ATR), an indicator that gauges market volatility and helps traders identify potential trading opportunities.
Delving into the Average True Range
The ATR, developed by famed technical analyst J. Welles Wilder, provides a quantifiable measure of price range over a given time period. It encompasses both bullish and bearish price movements, making it a comprehensive indicator of market volatility. Traders commonly use the ATR to:
- Assess potential risk levels
- Determine appropriate stop-loss and take-profit targets
- Identify potential breakout points
Calculating the ATR
The ATR is calculated using a specific formula that takes into account the true range of the current period and the ATR value from the previous period. The true range is defined as the greatest of:
- Current high minus current low
- Absolute value of (current high – previous close)
- Absolute value of (current low – previous close)
Interpreting ATR Values
The ATR is expressed in the same unit as the financial instrument being analyzed. Higher ATR values indicate greater market volatility, while lower values suggest a calmer market. Traders typically interpret ATR readings as follows:
- Low ATR: Indicates low volatility and potentially less risk.
- Medium ATR: Suggests moderate volatility and requires cautious risk management.
- High ATR: Signals high volatility and warrants stricter risk controls.
Practical Applications of the ATR Indicator
The ATR finds countless applications in practical trading:
- Stop-Loss Placement: Traders can use the ATR as a guide to determine appropriate stop-loss levels based on market volatility.
- Risk Assessment: By incorporating the ATR into their risk management strategy, traders can better estimate potential losses and tailor their trade size accordingly.
- Volatility Scalping: Traders can attempt to capitalize on short-term price fluctuations by entering and exiting positions when the ATR is high, indicating increased volatility.
- Identifying Breakout Points: High ATR values can often precede price breakouts, signaling potential trading opportunities.
Case Study Example
Consider a hypothetical scenario where the EUR/USD currency pair has an ATR reading of 20 pips. This suggests that the market is experiencing moderate volatility. A trader may set their stop-loss 15 pips away from their entry price, anticipating that the price will not fluctuate more than 35 pips (ATR + stop-loss buffer) in the given time frame.
Conclusion
The ATR indicator is a versatile tool that provides traders with valuable insights into market volatility. By incorporating the ATR into their trading strategies, traders can enhance their risk management, refine trade execution, and potentially identify profitable trading opportunities. Remember, while technical indicators like the ATR can provide guidance, they should not be used in isolation when making trading decisions. Sound judgment, technical analysis, and fundamental analysis remain essential for successful forex trading.
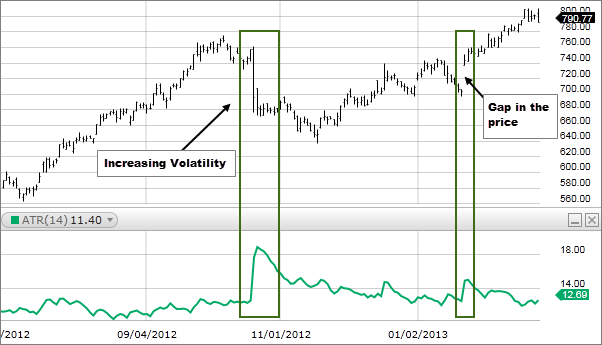
Image: www.fidelity.com
Average True Range Indicator Explained Trick Forex


