In the fast-paced world of forex trading, it’s crucial to have a keen eye for market trends and indicators that can help you make informed decisions. Join me as I reveal the top 10 indicators that have proven their worth in the forex arena, empowering you with the knowledge to navigate the ever-changing market landscape and seize profitable opportunities.

Image: www.dailyfx.com
The Foundation of Technical Indicators
Technical indicators are mathematical calculations applied to price data to identify potential trading opportunities based on historical trends and chart patterns. These tools analyze price movements, volume, and other market data to provide insights into future market behavior.
1. Moving Averages
Moving averages smooth out price data, eliminating noise and revealing the underlying trend. They help determine support and resistance levels and indicate potential trend changes.
Types: Simple Moving Average (SMA), Exponential Moving Average (EMA), Weighted Moving Average (WMA)
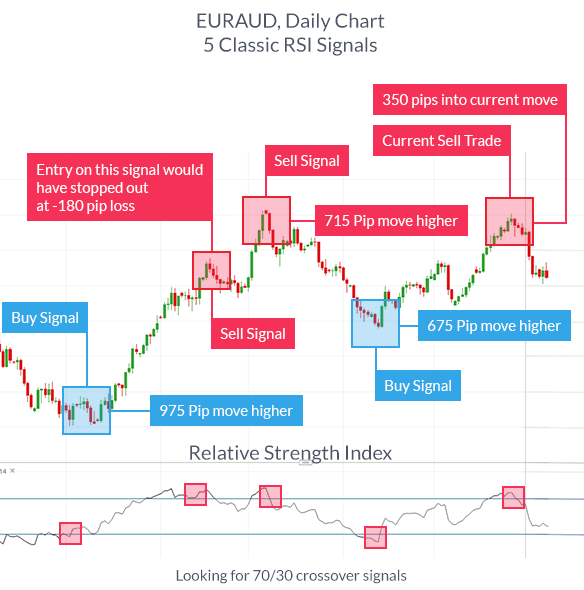
2. Relative Strength Index (RSI)
The RSI measures price momentum and indicates overbought or oversold conditions. It helps identify potential trend reversals and pinpoint optimal entry and exit points.
- Overbought: Above 70
- Oversold: Below 30

Image: forexautotraderreview.blogspot.com
3. Moving Average Convergence Divergence (MACD)
The MACD measures the relationship between two exponential moving averages and displays the difference as a histogram. It indicates potential trend reversals when the MACD line crosses the signal line.
4. Bollinger Bands
Bollinger Bands are volatility bands that plot upper and lower limits around a moving average. They help identify potential trend reversals and overbought/oversold conditions.
Formula: Middle Band (Simple Moving Average), Upper Band (Middle Band + 2 σ), Lower Band (Middle Band – 2 σ)
5. Stochastic Oscillator
The Stochastic Oscillator measures the momentum of a security by comparing its closing price to the range of its prices over a period. It helps identify potential reversals and overbought/oversold conditions.
Formula: %K = (Current Close – Lowest Low)/(Highest High – Lowest Low) * 100, %D = 3-period SMA of %K
6. Ichimoku Cloud
The Ichimoku Cloud is a comprehensive technical indicator that combines multiple moving averages, oscillators, and price history to provide a comprehensive view of a security’s trend and momentum.
Components: Tenkan-sen (9-period EMA), Kijun-sen (26-period EMA), Chikou Span, Kumo (Cloud)
7. Fibonacci Retracement Levels
Fibonacci Retracement Levels are support and resistance levels based on the Fibonacci sequence. They help identify areas where price often pauses or reverses after a significant move.
Common Levels: 38.2%, 50%, 61.8%, 78.6%
8. Pivot Points
Pivot Points are calculated using high, low, and closing prices from the previous trading session. They provide support and resistance levels that can be used for price analysis and potential trading opportunities.
9. Average True Range (ATR)
The ATR measures market volatility by calculating the average range of true range values over a specified period. It helps determine potential stop-loss levels and risk management strategies.
Formula: ATR = (Previous ATR * (n-1) + Current TR)/n, where TR = Max(Abs(H-L), Abs(H-C), Abs(L-C))
10. Volume
Volume is a crucial indicator that measures the number of transactions occurring. High volume typically confirms a trend while low volume can indicate indecision or a potential reversal.
Expert Advice: Mastering Technical Indicators
While technical indicators provide valuable insights, it’s essential to remember that they are not failproof. Effective use requires a combination of indicators and solid trading strategies. Here are a few expert tips to maximize their potential:
- Use multiple indicators: Combine different indicators to validate signals and increase accuracy.
- Look for confirmation: Avoid making decisions based on a single indicator. Confirmation from multiple sources enhances trading confidence.
- Consider the market context: The effectiveness of indicators can vary depending on market conditions. Analyze the market environment and adjust your trading strategy accordingly.
FAQs: Forex Trading Indicators
Q: What is the most important forex trading indicator?
A: The moving average is widely considered a crucial indicator due to its versatility and adaptability.
Q: How do I interpret technical indicators?
A: Analyze indicators in the context of price data and market trends. Look for patterns, crossovers, and divergences that provide trading signals.
Q: Can technical indicators predict the future?
A: While technical indicators provide valuable insights, they cannot predict the future with certainty. They are tools that aid in analyzing past data and identifying potential trading opportunities.
Top 10 Indicators In Forex Trading
Conclusion
Empowering yourself with the knowledge of these top 10 indicators equips you to navigate the complex world of forex trading with confidence. Remember, technical analysis is an art as much as a science. Constant learning, practice, and adaptation are essential to maximize your trading potential. So, embrace these tools, sharpen your trading skills, and turn the forex market into your playground of profitability.
Are you ready to unlock the secrets of forex trading with these invaluable indicators? Share this article with fellow traders and let us know your thoughts in the comments below.


