

Introduction
In the dynamic world of forex trading, finding reliable tools and techniques to analyze price movements is crucial. One such time-tested tool that has stood the test of time is the Fibonacci sequence. Derived from nature’s golden ratio, Fibonacci retracement levels provide traders with valuable insights into potential market reversals and support and resistance zones. Delve into this comprehensive guide to discover how to harness the power of Fibonacci in your forex trading endeavors and elevate your investment strategy.

Image: www.pinterest.com
Understanding Fibonacci Ratios
The Fibonacci sequence is a series of numbers in which each succeeding number is the sum of the two preceding numbers. The most common ratios used in technical analysis are 0.236, 0.382, 0.500, 0.618, and 0.786. These ratios are derived from the golden ratio, approximately 1.618. Forex traders believe that these ratios often serve as critical support and resistance levels, influencing price movements.
Fibonacci Retracement Levels
Fibonacci retracement levels are horizontal lines drawn at specific percentages based on the Fibonacci ratios. They indicate potential areas where the price may retrace after a significant upward or downward move. The most common Fibonacci retracement levels are:
- 23.6% – Represents a moderate retracement level, often providing temporary support or resistance.
- 38.2% – Indicates a significant retracement level, where the price may find strong resistance or support.
- 50.0% – Marks a midpoint retracement, potentially suggesting a change in price direction.
- 61.8% – Often acts as a major retracement level, where price reversals or trend continuations occur.
- 78.6% – Represents a deep retracement level, where a significant reversal is possible.
Applying Fibonacci Retracement to Forex Trading
To apply Fibonacci retracement to forex trading, select a significant swing high and swing low in the price chart. Draw a Fibonacci retracement tool, connecting the high to the low. The resulting lines will create the Fibonacci retracement levels.
Identify potential support and resistance zones at these retracement levels. When the price reaches a retracement level, it may rebound, indicating support, or reverse, signifying resistance.
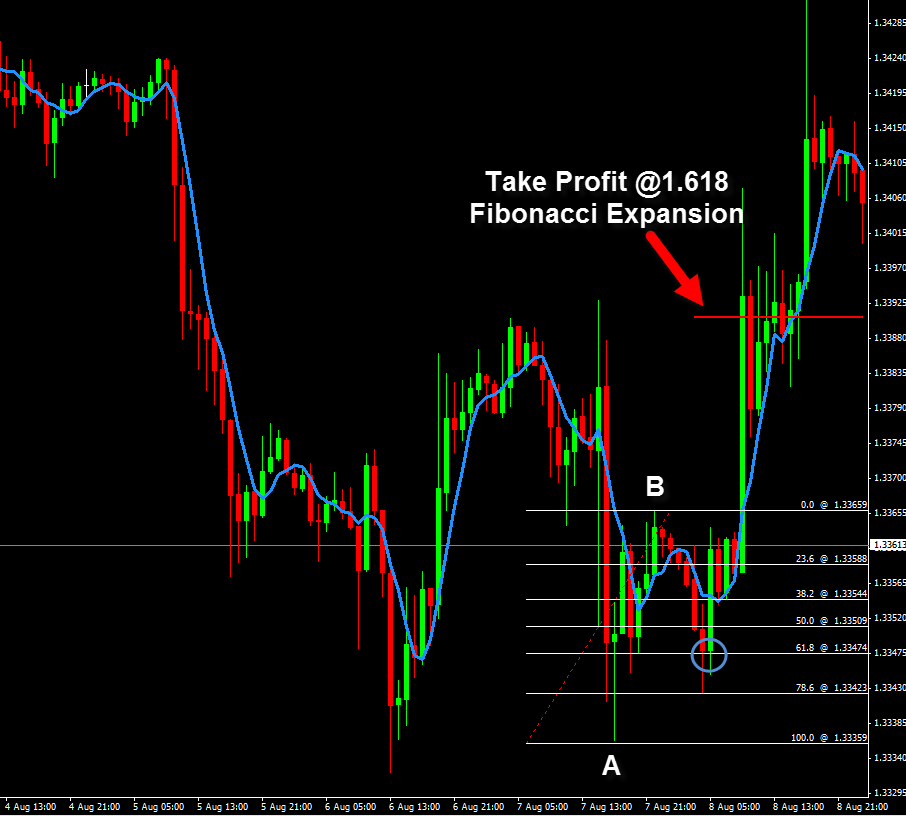
Image: acikubolex.web.fc2.com
Limitations of Fibonacci Retracements
While Fibonacci retracement levels are a valuable tool, it’s essential to acknowledge their limitations:
- Fibonacci levels are not exact, and price movements may not always adhere strictly to them.
- They are not predictive indicators and solely provide potential zones of interest.
- Combining Fibonacci retracements with other technical analysis tools and indicators can increase their effectiveness.
How To Use Fibonacci In Forex
Conclusion
Mastering Fibonacci in forex trading can empower investors with an invaluable tool for analyzing price movements and identifying potential support and resistance levels. By understanding Fibonacci ratios and applying retracement levels to their trading strategies, forex traders can enhance their ability to make informed decisions, manage risk, and capitalize on market opportunities. Remember, while Fibonacci retracements are not foolproof, they offer valuable insights into market behavior when used in conjunction with other analytical techniques.


