

The world of forex trading is fraught with uncertainty, but armed with the right knowledge and strategies, traders can navigate these volatile waters with confidence. Among the many technical analysis tools available, the double top and double bottom patterns stand out as reliable indicators of potential price reversals. In this comprehensive guide, we will delve into the intricacies of these patterns, equipping traders with the insights they need to maximize trading opportunities and mitigate risks.

Image: www.pinterest.com
Introduction to Double Tops and Double Bottoms
Double tops and double bottoms are chart patterns that signal a potential change in the direction of an asset’s price. These patterns consist of two consecutive peaks (double top) or troughs (double bottom) separated by a brief recovery or decline. The formation of these patterns suggests that there is an equilibrium between buyers and sellers, leading to a temporary pause in the prevailing trend. However, the subsequent breakout of these patterns often indicates a significant shift in market sentiment, paving the way for lucrative trading opportunities.
Identifying Double Tops and Double Bottoms
Recognizing double tops and double bottoms requires a keen eye and an understanding of their key characteristics:
Double Top:
- Two consecutive peaks separated by a minor decline or recovery
- The second peak forms at or slightly below the level of the first peak
- A neckline, drawn horizontally through the lows between the two peaks, serves as a critical support level
Double Bottom:
- Two consecutive troughs separated by a minor rally or decline
- The second trough forms at or slightly above the level of the first trough
- A neckline, drawn horizontally through the highs between the two troughs, acts as a crucial resistance level
Trading Strategies Involving Double Tops and Double Bottoms
Traders can capitalize on double tops and double bottoms by adopting specific trading strategies:
Trading the Breakout:
- For double tops, a breakout occurs when the price falls below the neckline, signaling a potential downtrend.
- For double bottoms, a breakout occurs when the price rises above the neckline, indicating a potential uptrend.
- Traders can enter long positions after a breakout above the neckline in a double bottom pattern or short positions after a breakdown below the neckline in a double top pattern.
Stop-Loss Placement:
- Stop-loss orders should be placed below the neckline for double tops and above the neckline for double bottoms.
- This ensures that the trade is closed if the breakout fails, limiting potential losses.
Take-Profit Levels:
- Target profit levels can be determined based on the height of the pattern, measured from the neckline to the peak or trough.
- For instance, a trader might aim for a profit target that is equal to the height of the double top pattern.
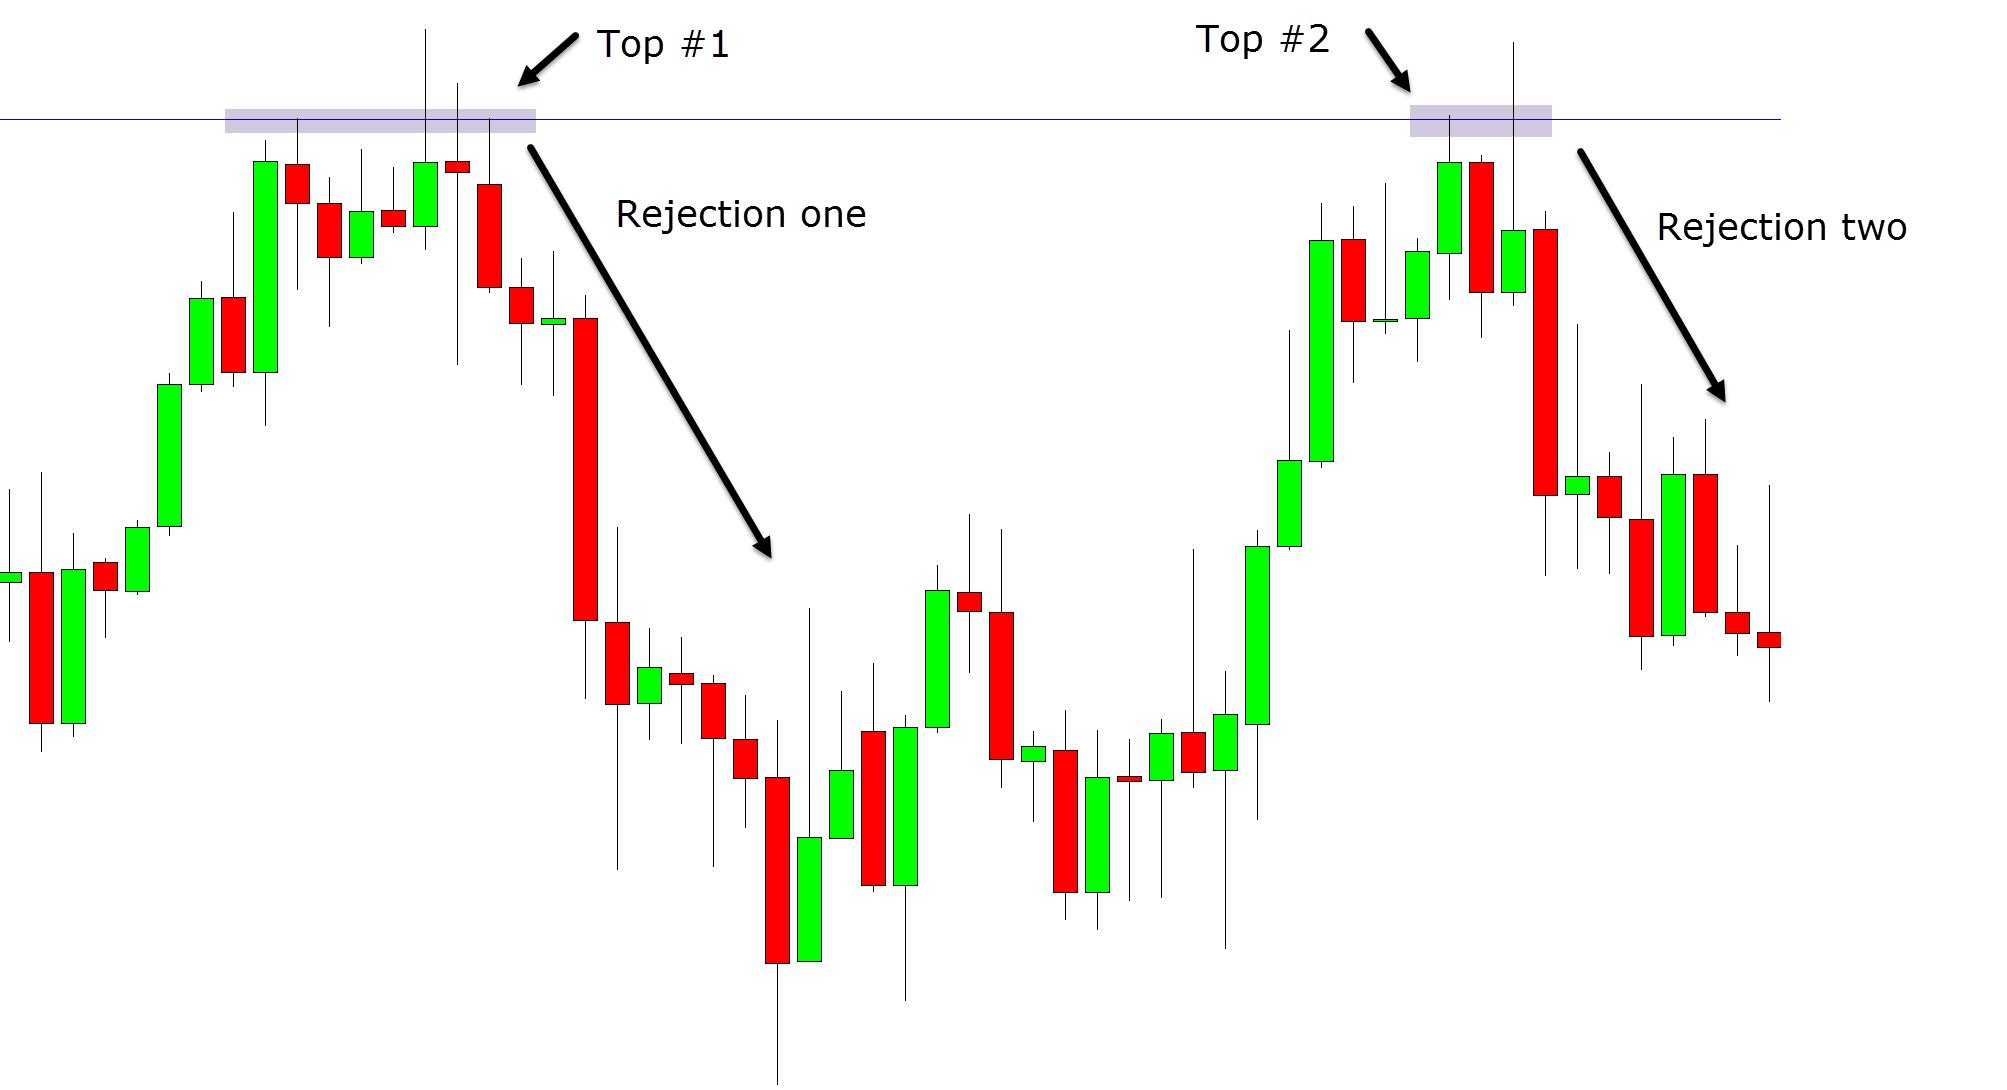
Image: learnpriceaction.com
Examples of Double Tops and Double Bottoms in Real-World Trading
Historical charts provide numerous examples of successful trades based on double top and double bottom patterns. Consider the following examples:
USD/JPY Double Top:
- The USD/JPY currency pair formed a double top pattern between April and July 2022.
- The price hit a resistance level near 135.00 twice, failing to sustain its upward momentum.
- A breakout below the neckline in July triggered a significant downtrend, resulting in a profitable opportunity for short sellers.
GBP/USD Double Bottom:
- The GBP/USD currency pair exhibited a double bottom pattern during the summer of 2021.
- The price found support at the 1.3800 level twice before rallying upward.
- A breakout above the neckline in August signaled a change in trend, allowing traders to capitalize on the subsequent uptrend.
Double Top And Double Bottom Forex Pattern
https://youtube.com/watch?v=luyF_enPa5U
Conclusion
Double top and double bottom forex patterns are valuable tools for discerning traders seeking to anticipate market reversals. By recognizing these patterns and adopting sound trading strategies, traders can significantly enhance their profitability and minimize risk. It is crucial to note that no trading strategy can guarantee success, and traders should always conduct thorough research and exercise prudent risk management practices. With a comprehensive understanding of double tops and double bottoms, forex traders can navigate the complex world of currency trading with greater confidence and seize the opportunities that these patterns present.


